Wednesday, May 31, 2006

BackTrack v1.0 Final Release

Just to pretend like I have something updated in my blog, BackTrack - one of the coolest Cyber Security LiveCD unleashed. I'm currently downloading it and hopefully I can spend some times to play with it. You can find the BackTrack info here.

The LiveCDs that worth to be kept in my pocket are Helix and BackTrack at the moment since both LiveCDs are the quickies for me when I need to use the related tool. Maybe there are other alternatives out there but then I have no time to try out so many distros for current moment.

That's all for now .....

- Peace -

Busy .. busy ..

I have been very busy with my personal life lately and having no times to tinker with much stuffs, will try to update my blog as soon as possible once I have time in hand.

Yeah regarding the progress of OpenNSM project, me and my pal are still working on it, it is ongoing project that need to be done correctly in timely manner, if any of you have experience in writing OpenBSD port, indeed we need more hands since we are busy.

For myDEFCON LiveCD, the outline is done and proceed to work on enhancements and modifications. Again like I said, need more hands on that too, 24 hours never enough for a person like me.

Anyway Cheers :]

Wednesday, May 24, 2006

Forensic Analysis

I have been reading about file system forensic and analysis here and there, and without putting it into my practical work, it seems that I can't get to master or at least handy when performing file system forensic analysis, I decide to be more systematic where I have collected the documentations online and few good and recommended books, that may help me to learn in more efficient way. Of course my priority always falls to Open Source Tools, Sleuthkit/Autopsy and Pyflag will be my primary tool through out the learning process. Helix Live CD will be used since it contains lots of forensic tools as well. Here are my to-learn list in sequence -

http://www.efense.com/helix/docs.php

http://www.realdigitalforensics.com/real-digital-forensics-blog

http://www.porcupine.org/forensics/forensic-discovery/

http://www.sleuthkit.org/informer/index.php

http://www.digital-evidence.org/fsfa/

By the way, I have just successfully installed Sleuthkit/Autopsy which is the latest release that support Export Witness and AFF file format on OpenBSD. In order to get it install, you need to use gmake instead of make, just install gmake via package/port will do. Since both Sleuthkit and Autopsy are not too tricky to install, I won't show here again. However if you do have problem of getting them installed, feel free to email me. Below are the only screenshot I have taken for Autopsy.


Cheers (:])

Tuesday, May 23, 2006

Sguil Sensor Monitoring & Reporting

People are concerning about their network security most of the time, so monitoring network security is important, however rarely that we hear people concerning about whether their monitoring devices go wrong or malfunction instead of working properly. Especially in distributed sensors setup environment, monitoring the health and status of sensors considered part of the important role.

If you happen to use OpenBSD, there's a tool that available in the port called symon, it has been ported to FreeBSD and linux as well. Symon is light weight system monitor that used to monitor the health of system either locally or remotely with symux collecting and displaying the statistic. The beautiful part of it should be priviledge dropping so that symon won't run as root, and you can download syweb which will draw the rrd graphs based on your configuration that works perfectly with chrooted Apache as well.

With symon, you can even specify what process to monitor such as snort, httpd and etc. That is useful to know how much resources been used by your IDS or daemon. I'm currently still testing it before deploying on productive environment and quite satisfy with the result. I won't be showing you here how I get it done since the documentation that you can view here good enough to get it work.

Symon is one fine tool that you can use to monitor the health of your sensor remotely with it's small footprint. I supposed people will love it for the sake of it's flexibilities too.

Below are the 4 screenshots of symon -


Another application that I have tried would be the project that developed by one of Sguil fellow, Paulh. Squert is a so called Simple Query And Report Tool for Sguil. It is useful because it is connected directly to the mysql DB and allows you to perform Sguil DB query and generate the reports out of it, it has been claimed very useful in mass sensors environment by Paulh :P.

Below are 2 screenshots of Squert -


Symon and Squert are both incredible tools for people who are deploying distributed mass sensors. One for the sake of health monitoring and another for the sake of reporting, I do wish that Squert can generate graphic report in the future which lacks in the NSM suite.

That's all for now, cheers :]

Monday, May 22, 2006

Bro-IDS - Be Loved

During my off day, I take my time to read about another interesting Open Source Network Intrusion Detection System - Bro-IDS. Beside Snort, I think it is another Open Source NIDS with riches of protocol analyzers and cool features.

I'm reading almost all the papers that published by Bro-IDS community which you can find here. I'm pretty enjoyed when reading the papers regarding Dynamic Application Layer Protocol Analysis For Network Intrusion Detection and Building a Time Machine for Efficient Recording and Retrieval of High-Volume Netowrk Traffic. The first one outlines the problem of static port based protocol decoding such as using http analyzer when traffic flowing through port 80 and what if the http traffic that flowing through other port instead of standard well-known port or maybe non-http traffics that tunneling through port 80. Bro-IDS implements the protocol identification analyzer[PIA] to solve the problem. The second paper emphasizes on the important of collecting full content data in high speed network and providing workaround of storage issue with various methods such as traffic prioritizing, cutoff, classification, bpf filter and etc. In NSM approach, full content data is very important and I think this paper is very useful especially most of the sguil users deploy NSM by using commodity hardware and that's what has been used to test in the paper with very impressive result.

I'm quite fascinated by what Bro-IDS offers, though it is not as popular as Snort, however the capabilities of Bro-IDS can't be underestimated at all.

At the time of writing, I have no luck with compiling Bro-IDS 1.1 which is current release on OpenBSD , previous version(0.9) was compiled succesfully however I would like to try out the latest release since it has more advance features and bugfixes.

If you have deployed Bro-IDS, feel free to comment and I would like to know your experience on it.

Peace :]

Saturday, May 20, 2006

PADS Signature Writing

Since PADS lacking of signatures, it is not efficient enough to do services profiling, so I think adding signatures to it might be good since it is now integrated to Sguil. After navigating the PADS signature file with my slightly understanding of PCRE, I start working on it, the services signature looks similar to nmap services probe sig, I decide to use nmap -sV to generate the traffic and grabbing the banner for sig writing.

In my case, I copy all the PADS config files to /etc/sguils. The main configuration for PADS is pads.conf, I renamed it to pads-test.conf, here's my config -

# Pads Configuration - pads-test.conf

daemon 0
pid_file /var/run/pads.pid
sig_file /etc/sguils/pads-signature-list
mac_file /etc/sguils/pads-ether-codes
user pads
group pads
interface pcn0
network 192.168.1.0
output screen

You may see I choose to output it to screen, that is useful when you are experimenting with the new signatures writing as well as testing. The signatures file for PADS are pads-signature-list and pads-ether-codes, pads-ether-codes only storing the info of vendor's code that map to the first 24 bits of MAC address, pad-signature-list is the heart of PADS where it stores all the services signatures.

After tinkering with it, I had these two signatures written and adding it to pads-signature-list. One for X11 and another for ssh.

ssh,v/OpenSSH/$2/Protocol $1/,SSH-([.\d]+)-OpenSSH[_-]([\S]+)[\s]+[\n]

x11,v/Xorg//Access Denied/,^\0\x16\x0b...\x06.No\x20protocol\x20specified\x0a\x04\x3c

I rerun PADS again this time, instead of getting unknown applications, now I seem to get the result I wanted.

shell>pads -c pads-test.conf

pads - Passive Asset Detection System
v1.2 - 06/17/05
Matt Shelton

[-] Filter: (null)
[-] Listening on interface pcn0

[*] Asset Found: Port - 22 / Host - 192.168.1.55 / Service - ssh / Application - OpenSSH 4.3 (Protocol 1.99)
[*] Asset Found: Port - 6000 / Host - 192.168.1.55 / Service - x11 / Application - Xorg (Access Denied)

[-] 1107 Packets Received
[-] 0 Packets Dropped by Software
[-] -2116931312 Packets Dropped by Interface

The services are recognized after I have added the signatures, however there's one thing I found weird, if you look at the last line - 2116931312 Packets Dropped by Interface, I'm not sured why it shows this negative amounts of packets which is huge. Anyone have experienced and figured out why, please comment!

By the way, this is about PADS Sig writing, I will add more sigs once I have time which I have done the same thing to tcpxtract. By the way I learn a few PCRE tricks when writing the signatures.

Cheers (:])

Thursday, May 18, 2006

OpenBSD PF logging with NSM

I haven't tried on this yet but this is just my shameless idea, since PF allows logging traffic of interest with log modifier, I'm thinking is it possible to just log only the network traffics that passing through the Firewall then running snort IDS on the PF logging pseudo interface which is pflog0. Additionally we also log the full content data of that interface. Yet with this method we only concentrate on the traffics that passing through the Firewall and ignoring the blocked traffic, we also save the space without logging every single bit(I bet you don't want to detect the blocked intrusion which is unsuccessful).

Another idea of mine would be The Automated Worm Screening System. I think this can be done with Open Source Tools. With snort2c, p0f, tcpkill/pfctl and OpenBSD PF, that's possible to block the worms propagation across networks. This is to create sort of Intrusion Prevention System but only concentrate on certain type of malicious traffics.

Last but not least, for people who have problem when writing PF filtering rules, you should enable the log features so that you know which filtering rules allow or deny the network traffic. That will slightly easier to debug instead of guessing blindly.

Just my 2 cent of da day .....

Cheers :]

Wednesday, May 17, 2006

FreeBSD Mass Installations Using OpenBSD PXE Setup

I try to setup PXE environment to install FreeBSD by using OpenBSD box. After tinkering with it, I have a great success and I think this should be shared in case anyone may find it useful, for OpenBSD installation, it is rather easy by following the OpenBSD faq. Here's how I get things work.

Setting up Tftp server

Uncomment the line with tftp in /etc/inetd.conf

tftp dgram udp wait root /usr/libexec/tftpd tftpd -s /tftpfbsd

shell>kill -HUP `pgrep inetd`

Setting up dhcp server

Adding the part below to /etc/dhcpd.conf

shared-network LOCAL-NET {
option domain-name "dissectible.org";
option domain-name-servers 192.168.0.100;

subnet 192.168.0.0 netmask 255.255.255.0 {
option routers 192.168.0.1;
filename "pxeboot";
option root-path "/usr/pxeboot";
range 192.168.0.201 192.168.0.240;
default-lease-time 84600;
max-lease-time 90000;
}
}

Now add one liner to /etc/rc.conf.local

shell>echo "dhcpd_flags=" >> /etc/rc.conf.local

To start without rebooting, change the $NIC to your network interface variable -

shell>dhcpd $NIC

Filename refers to the pxeboot that you copy to /tftpfbsd which the client will fetch it once getting IP from dhcp server.

Root-path refers to the nfs path that storing freebsd base files(for installation) that extracted from the FreeBSD 6.1 iso.

Setting up the Nfs Server

Create the directory you want to export as network file system.

shell>mkdir /usr/pxeboot

Adding the line belows to /etc/exports

/usr -alldirs -maproot=nobody

Or if you want to be stricter and only allow hosts in the 192.168.0.0/24 network to access only,

/usr /usr/pxeboot -maproot=nobody -network=192.168.0 -mask=255.255.255.0

To run everything manually,

shell>/sbin/nfsd -tun 4

shell>echo -n > /var/db/mountdtab

shell>/sbin/mountd -d /etc/exports

You can check the nfs server info with rpcinfo -p and showmount -a

To mount nfs filesystem

shell>mount -o ro -t nfs 192.168.0.55:/usr /mnt

Or to have it mounted on boot, add this to /etc/fstab

192.168.0.55:/usr/pxeboot /mnt nfs ro.nodev,nosuid 0 0

To put nfs starts onboot, add them to /etc/rc.conf.local

portmap=YES
nfs_server=YES
nfsd_flags="-tun 4"

After you have setup all the servers, you need to download FreeBSD installation iso.

shell>cd /tmp; wget \ ftp://ftp.freebsd.org/pub/FreeBSD/releases/i386/ISO-IMAGES/6.1/6.1-RELEASE-i386-disc1.iso

Now I have the iso, I need to extract the image contents out of it.

shell>vnconfig svnd0 /tmp/6.1-RELEASE-i386-dist.iso

shell>mount -t cd9660 /dev/svnd0c /mnt

Sync the content of the image to /usr/pxeboot/

shell>rsync -avH /mnt/ /usr/pxeboot/

By now you have the content of FreeBSD 6.1 image in /usr/pxeboot.

Then append this part to /usr/pxeboot/boot/loader.rc

load /boot/kernel/kernel

load -t mfs_root /boot/mfsroot

set vfs.root.mountfrom="ufs:/dev/md0c"

boot

Copy the pxeboot to the tftp server directory

shell>cp /usr/pxeboot/boot/pxeboot /tftpfbsd

Reboot it once you have everything configured.

It's done now and you can start the network client with netboot. If you are installing fbsd using nfs, just specify /usr/pxeboot as base directory when asked.

I use this setup to install FreeBSD 6.1, for anyone who owns IBM Thinkpad x41 where you don't have the docking station, this is the best way to install FreeBSD 6.1 on it since you can't install with your usb combo drive.

Here are the internet resources I found useful,

http://typo.submonkey.net/articles/2006/02/12/having-a-bad-day


http://gja.space4me.com/things/Using_pxeboot_Install53.html


http://www.openbsd.org/faq/faq6.html#PXE


I wrote a simple pxe setup script to automate the setup since I hate doing the same things over and over again. You can download it here.

Peace :]

Sunday, May 14, 2006

HTTP Request

There are different kind of http request methods that supported by the web servers that based on thier implmentation and configuration. The recent OpenBSD team that decides to turn off trace method of their apache distribution to protect against XSS considered a right move since it is not much in used and render the server vulnerable to attack.

If you are heavy curl user, you may already know that curl allows you to custom your own http request method with -X switch. However I have recently came across this tool call metoscan that allows you to perform checking on the http requests that enabled and supported by the web server. It is considered a nifty tool to initiate pentest against web server. You may find other http related tools as well from here.

I downloaded metoscan and start compiling with gcc -o bla bla bla. To scan the web server, one just need to run it with target url provided. For example,

shell>./metoscan 1.2.3.4

MetoScan - Simple HTTP Method Scanner

Method: GET => 302 (MOVED TEMPORARILY)
Method: POST => 500 (INTERNAL SERVER ERROR)
Method: HEAD => 302 (MOVED TEMPORARILY)
Method: PUT => 302 (MOVED TEMPORARILY)
Method: TRACE => 200 (OK)
Method: TRACK => 302 (MOVED TEMPORARILY)
Method: SEARCH => 302 (MOVED TEMPORARILY)
Method: INDEX => 302 (MOVED TEMPORARILY)
Method: OPTIONS => 302 (MOVED TEMPORARILY)
Method: DELETE => 302 (MOVED TEMPORARILY)
Method: CONNECT => 400 (BAD REQUEST)
Method: PATCH => 302 (MOVED TEMPORARILY)
Method: PROPFIND => 302 (MOVED TEMPORARILY)
Method: PROPPATCH => 302 (MOVED TEMPORARILY)
Method: MKCOL => 302 (MOVED TEMPORARILY)
Method: COPY => 302 (MOVED TEMPORARILY)
Method: MOVE => 302 (MOVED TEMPORARILY)
Method: LOCK => 302 (MOVED TEMPORARILY)
Method: UNLOCK => 302 (MOVED TEMPORARILY)
Method: CHECKOUT => 302 (MOVED TEMPORARILY)
Method: SHOWMETHOD => 302 (MOVED TEMPORARILY)
Method: LINK => 302 (MOVED TEMPORARILY)
Method: UNLINK => 302 (MOVED TEMPORARILY)
Method: CHECKIN => 302 (MOVED TEMPORARILY)
Method: TEXTSEARCH => 302 (MOVED TEMPORARILY)
Method: SPACEJUMP => 302 (MOVED TEMPORARILY)
Method: ORDERPATCH => 302 (MOVED TEMPORARILY)
Method: ACL => 302 (MOVED TEMPORARILY)
Method: VERSION-CONTROL => 302 (MOVED TEMPORARILY)
Method: REPORT => 302 (MOVED TEMPORARILY)
Method: UNCHECKOUT => 302 (MOVED TEMPORARILY)

If you understand what's the http status code, you may understand better the output of it. I have mentioned the important of understanding http status code previously and now it helps me to intepret the result easily.

Enough for now, it's Saturday nite here :P

I should go out to get some b33r5,

Ch33r5 :]

Saturday, May 13, 2006

Bad Day

My lovely testing machine is dead, I totally have no idea how to fix it since it keeps popping error after booting, it must be hardware issue.

I have been busy with my hardware stuffs and trying to clean things up, however sometimes when luck is not with you, you may always get things like OS dropping into debugger shell, OS can't be loaded properly and other mess. I have been trying hard to fix them now. Old hardware is always sensitive where you can't simply pull the plug!!!!!

I'm still looking around to get old hardware which is abandonned. There are lots of people out there abandon their old hardware and just putting it at home in dead state, I would like to give a life to those hardware and one of my friend says that he has tons of old hardwares that he hasn't tested and may pass it to me, I'm looking forward to build my better testing lab with them.

Don't put the machine aside, give them life :]

Friday, May 12, 2006

Large Scale of Sguil Sensor Installation

After sometimes of installing Sguil manually, and with sguil installation script done that easing my installation process, I still feel that it is not efficient enough when comes to the large scale of NSM deployments. Instead of working for the machine, I would prefer the machine working for me. Thus, I'm pretty interested in using PXE BOOT to perform massive Sguil Sensors installation which almost having the same set of installation and configuration that may save whole lots of times. Anyone has done OpenBSD PXE NETBOOT installation, please comment.

There's nifty guide on OpenBSD faq, check it out here.

By the way, me and my pal who want to keep himself low profile, are working on the project called OpenNSM. We are targetting on making OpenBSD Sguil Installation ISO. Work in progress and may release once we finished it. Stay tuned.

Peace :]

Thursday, May 11, 2006

The Art Of Defensive

Firewalling used to be very versatile and effective in defending and guarding your network. However it is only useful in the situation where it can block most of the network traffics with malicious packet header.

However one weaknest point about Firewall should be its lacking of capability to throttle the already initiated and established connections. Hence the hackers used to take advantage of this especially when they are performing DDOS.

A single host connecting to web services with multiple threads enough to consume http resources easily to reach the max client limit and render your web services down. Especially if the malicious host connecting with validate tcp 3 way handshake where we can't just block by the packet header. In OpenBSD PF, you can add the malicious hosts IP to the table to drop it's connection, however that's not enough to kill massive DDOSING since you have to define the malicious hosts and adding them to the table. Furthermore, you can't drop the already established connection and this is totally causing havoc where the services hardly offer it's resources to the legitimate connection from your web client. This problem not only bounced to web services but any services that utilizing TCP such as dns, smtp as well.

However I will concentrate on web services here. HTTP is stateless, though it is carried over TCP, however the connection itself shouldn't be sticky. Thus we know that if same IP appears in the netstat output multiple times which connecting to port 80.

This shouldn't be right. Thus we need to find a way to throttle/kill the connections from this particular IP which should be malicious before adding it to either iptables chain or PF table. With that we will be able to kill the already established connections from the malicious IP and blocking it's further connections.

There are 4 tools that allows you to kill TCP connections easily -

Flowgrep - http://monkey.org/~jose/software/flowgrep/

Cutter - http://www.lowth.com/cutter/

TCPkill - http://monkey.org/~dugsong/dsniff/

TCPdrop - OpenBSD Native tool

I have mentioned flowgrep for couple of times and just save my words for other tool here. To kill the connections, what you need to do is specify the IP that you want to kill or you can be more specific by killing hosts that initiated connected connection with certain port.

Cutter is useful if you install in the Firewall Device, it can't do much when you are trying to kill the connection to the host with cutter installed but only good in killing connections that going through the Firewall Device with cutter installed. Cutter installation is straight forward, just gcc -o cutter cutter.c will do. The cutter syntax is pretty straight forward which is - cutter DST IP DST PORT SRC IP SRC PORT. For example if you want to kill the connection from 1.2.3.4,

shell>cutter 1.2.3.4

Or if you want to kill all http connections from 1.2.3.4

shel>cutter 1.2.3.4 80

That's pretty self-explanatory. The other useful tool should be TCPkill which is actually come together with dsniff-suite. TCPkill is used to kill the connection as well, however it is more powerful than cutter since you can use it to kill any TCP connection to your host instead of relying on border router ACL or Firewalling. For example to kill the connection from 3.4.5.6, just run

shell>tcpkill -i eth0 host 3.4.5.6

TCPkill is powerful as it supports bpf filter. You can kill multiple hosts at once with

shell>tcpkill -i eth0 host 3.4.5.6 or host 4.5.6.7 or host 5.6.7.8

The last one I would like to mentionned is TCPdrop that actually installed by default in OpenBSD base system. Not much people know about it and it should be used to throttle malicious network traffic without relying third party tools. To drop the connections from 6.7.8.9, just run

shell>tcpdrop 6.7.8.9

The syntax is kind of similar to cutter and you can kill by specifying port as well.

Now we have all the alternative tool, how can we make use of it in DDOS situation, we should drop those connections that already initiated and established by malicious host and adding those IP to either IPtables or PF. In PF, you can use source tracking to disallow certain IP to exceed the state or if you are on Linux, you can make a counter on netstat output and if a single IP exceed the counter, just add it to iptables with -I on the fly. This may insert it into the rules and blocking further connections from that particular IP. I won't show the full script here that doing everything where it kills the non-legitimate connections add to the IPtables of PF. But here's the simple tip to check on it, I have tried this on CentOS and having very good result defending DDOS. To make a counter per IP, just run -

shell>netstat -plan|grep :80|awk {'print $5'}| \
cut -d: -f 1|sort|uniq -c|sort -nk 1 | \
awk '{if ($1 > 10 && $2 != 0.0.0.0) print $2 }'

With the command above, you maybe able to get all the hosts with more than 10 connections to the same port(80) in netstat result. Once you have those IPs, you can throttle them with the tools mentioned above and add them to firewall rules on the fly. This will be really helpful. In order to automate it, you may need to write your own script to do it all for you but I think that's not too hard, right! And if you don't want to block the IPs forever, just make use of expiretable that I have mentioned here.

Have fun, cheers (:])

Wednesday, May 10, 2006

OpenBSD and FreeBSD New Release

This is late news, and I suppose everyone already knew it, OpenBSD 3.9 is out and so do FreeBSD 6.1. I'm currently downloading FreeBSD 6.1 and may install it later. If you love OpenBSD, please donate to the project as it is currently lack of fund. If you ever happen to use OpenSSH, please consider donating to keep the project going as well. For freeBSD team, thanks again for creating such brilliant OS, you guys rox!!!!!

- When {Puffy} Meets ^RedDevil^ -

Cheers :]

Friday, May 05, 2006

OpenBSD 3.9 Sguil Client Installation

I finally get Sguil Client installed in more clean method, I compiled everything from source and making use of stow for application management purpose. I have written a very simple Sguil Client installation script which will merge to Sguil Server and Sensor installation script later. I have also tar all the necessary source tarball and hosting it at dissectible.org. I have also included the md5 and sha1 checksum value for security purpose. Here's the script -

#!/bin/sh

# OpenBSD-3.9 Sguil Client Installaition Script - sguilC-install.sh
# Written by geek00L[20060505]

# Note: Please install wget and stow from port/package
# It is needed in order to get Sguil Client installed!

sguilC_REPO=/tmp/sguilC
Appdir=/usr/local/stow

# Creating Application Directory
mkdir $Appdir

# Download all the sources
wget http://www.dissectible.org/anonymous/Misc/sguilC.tar.gz

# Untar the Source
cd /tmp
tar xvzf sguilC.tar.gz

# Installation started .....

# Tcl Installation

cd $sguilC_REPO/tcl8.4.13/unix

./configure --prefix=$Appdir/tcl-8.4.13

make && make install

cd $Appdir && stow tcl-8.4.13

ln -s /usr/local/bin/tclsh8.4 /usr/local/bin/tclsh


# Tk Installation

cd $sguilC_REPO/tk8.4.13/unix

./configure --prefix=$Appdir/tk-8.4.13

make && make install

cd $Appdir && stow tk-8.4.13

ln -s /usr/local/bin/wish8.4 /usr/local/bin/wish

# Copy tclConfig.sh and tkConfig.sh from /usr/local/lib to /usr/local/lib/tcl8.4
# and /usr/local/lib/tk8.4 so that itcl and iwidgets installing fine.

cp /usr/local/lib/tclConfig.sh /usr/local/lib/tcl8.4

cp /usr/local/lib/tkConfig.sh /usr/local/lib/tk8.4


# Tcllib Installation

cd $sguilC_REPO/tcllib-1.8

./configure --prefix=$Appdir/tcllib-1.8

make && make install

cd $Appdir/ && stow tcllib-1.8


# Tcltls Installation

cd $sguilC_REPO/tls1.5

./configure --prefix=$Appdir/tls-1.5 --with-ssl-dir=/usr

make && make install

cd $Appdir && stow tls-1.5


# Tclx Installation

cd $sguilC_REPO/tclx8.4

./configure --prefix=$Appdir/tclx-8.4

make && make install

cd $Appdir && stow tclx-8.4


# Itcl Installation

cd $sguilC_REPO/itcl3.2.1

./configure --prefix=$Appdir/itcl-3.2.1 \
--with-tcl=/usr/local/lib/tcl8.4/ --with-tk=/usr/local/lib/tk8.4

make && make install

cd $Appdir && stow itcl-3.2.1


# Iwidgets Installation

cd $sguilC_REPO/iwidgets4.0.1

./configure --prefix=$Appdir/iwidgets-4.0.1 \
--with-tcl=/usr/local/lib/tcl8.4 --with-tk=/usr/local/lib/tk8.4 \
--with-itcl=$sguilC_REPO/itcl3.2.1

make && make install

cd $Appdir && stow iwidgets-4.0.1


# Now just downloading the Sguil Client and run sguil.tk will do

cd $Appdir

wget http://nchc.dl.sourceforge.net/sourceforge/sguil/sguil-client-0.6.1.tar.gz

tar xvzf sguil-client-0.6.1.tar.gz

cp -fR sguil-client-0.6.1 $Appdir/sguilC-0.6.1

# Other Sguil Client Repo
# http://superb-west.dl.sourceforge.net/sourceforge/sguil/sguil-client-0.6.1.tar.gz

# Testing the installation to see if tcl suite works properly
#tclsh
#% package require Tclx
#8.4
#% package require tls
#1.50
#% package require Itcl
#3.2
#% package require Iwidgets
#4.0.1

# EOF (:])

After the installation, you may need to tweak the sguil.conf in /usr/local/stow/sguilC-0.6.1 and run sguil.tk will do.

Have fun with sguil :]

OpenBSD Terminal - Adding Font

Most of the time I use either mrxvt or rxvt, and the default font is killing my eye when I launch rxvt in my OpenBSD box. It is better to change the font type for better view. Here's the quicky, I like how the linux font project - lfp font type looks like and that's quicky to get it work.

Download the lfp-var and lfp-fix at

http://sourceforge.net/project/showfiles.php?group_id=3465


Then untar and install it easily

shell>bzip2 -d lfpfonts-var-src-0.84.tar.bz2 | tar xf -

shell>bzip2 -d lfpfonts-fix-src-0.83.tar.bz2 | tar xf -

shell>cd lfpfonts-var-src/src

shell>compile

After compile, you may fine lfp-var directory in lfpfonts-var-src directory. Do the same with lfpfonts-fix as well, and now you need to copy them to the font directory

shell>cd .. && cp lfp-var /usr/X11R6/lib/X11/fonts/

Again copy the lfp-fix that you have after compiling it to /usr/X11R6/lib/X11/fonts.

Then add the lines below to the File Section of xorg.conf which located at /etc/X11

FontPath "/usr/X11R6/lib/X11/fonts/lfp-fix:unscaled"
FontPath "/usr/X11R6/lib/X11/fonts/lfp-var"

Now you can run

shell>xset fp+ /usr/X11R6/lib/X11/fonts/lfpfonts-var

shell>xset fp+ /usr/X11R6/lib/X11/fonts/lfpfonts-fix

shell>xset fp rehash

To know what font types you have and make sure lfp is there, run

shell>xlsfonts

Or you can use xfontsel to select and preview the font styles.

shell>xfontsel

To add the font to the xterm or maybe rxvt, just add them to .Xdefaults under user directory. For example

# XTERM Settings
xterm*fonts: -lfp-gamow-bold-r-normal--9-90-75-75-c-90-iso8859-5

# RXVT Settings
rxvt*fonts: -lfp-gamow-medium-r-normal--9-90-75-75-c-90-iso8859-5

Here's the result, I think it is better and intuitive compare to the default font which is small.


Cheers :]

Thursday, May 04, 2006

Snort - Rule Writing

I supposed to blog other stuffs but since there's someone asking me regarding snort rule, I think it would be nice to share with others. Sputera, has asked me about -

It came to my attention where any strings in "content" basically in ASCII. Now, attackers are intelligent enough. Can they translate the ASCII to HEX and detected in Snort.

WEB-IIS cmd.exe
Based on the rules, any strings with the word "cmd.exe" will trigger this alert.

Now, let say the attackers traslate it to HEX code, "63 6d 64 2e 65 78 65". Then, we write the rules content "63 6d 64 2e 65 78 65". Can or not?

But, basically HEX code are written in C/C++...

Let's correct the situation. Sputera, to clear your idea of how snort examines the packet, you should start learning looking at the packet content especially the payload itself, you should try either tcpdump or using snort in logger mode and read it with -r. Or if you find it too hard at first, try ethereal.

Snort normally will examine the payload, and the hex value normally will be converted to ascii for payload detection, so normally either the hex value "63:6d:64:2e:65:78:65" or "cmd.exe" will be detected when you using the content as payload detection method, remember content not only can be used to examine string but raw bytes. Normally attacker not translating it to hex but when the cmd.exe string sent through the wire, it will convert to binary form and translate back when it reaches the destination host and the packet is processed. That is nothing to do with bypassing the IDS, normally most of clever attackers will choose to either protocol tunneling, fragmentation or using covert channel to avoid detection of IDS instead.

And here's why it is not good to use hex value for detection but stick with the ascii strings with nocase. Before that, let's look at the default snort rule that used to detect cmd.exe through port 80 web service.

alert tcp $EXTERNAL_NET any -> $HTTP_SERVERS $HTTP_PORTS \
(msg:"WEB-IIS cmd.exe access"; flow:to_server,established; \
uricontent:"cmd.exe"; nocase; classtype:web-application-attack; sid:1002; rev:7;)

Since HTTP is TCP based, flow:to_server,established is perfect for the situation where connection should be established. URIcontent is used for http normalization, you should use uricontent instead of content matching since this is about http packet inspection.

About your idea to use hex value, I write a simple rule for it.

alert tcp any any -> any 80 (msg: "HTTP cmd.exe Access"; \
flow:to_server,established; content: "|63 6d 64 2e 65 78 65|"; \
rawbytes; classtype: web-application-activity;offset:5; sid;4000005)

This rule is simple, examine packet content with
"63 6d 64 2e 65 78 65" hex value which is cmd.exe , if you are writing your own rule, put it in local.rules. I use rawbytes to avoid using http inspection.

I start running snort with

shell>snort -c /etc/snort.conf -l /nsm/snort-test/log -K ascii -i vr0

Then I tail the /nsm/snort-test/log/alert file

shell>tail -f /nsm/snort-test/log/alert

Let's see what happen when I try to test it. This part you can use netcat to connect to port 80 but I just open the url with the internet browser -

http://202.75.42.254/bigsis/cmd.exe

Both rules was hit and alert shown ....

[**] [1:1002:7] WEB-IIS cmd.exe access [**]
[Classification: Web Application Attack] [Priority: 1]
05/04-18:05:52.672196 192.168.0.50:62552 -> 202.75.42.254:80
TCP TTL:64 TOS:0x0 ID:20087 IpLen:20 DgmLen:497 DF
***AP*** Seq: 0xA818A623 Ack: 0x9637D2D2 Win: 0xFFFF TcpLen: 20

[**] [1:4000005:0] HTTP cmd.exe Access [**]
[Classification: access to a potentially vulnerable web application] [Priority:2]
05/04-18:05:52.672196 192.168.0.50:62552 -> 202.75.42.254:80
TCP TTL:64 TOS:0x0 ID:20087 IpLen:20 DgmLen:497 DF
***AP*** Seq: 0xA818A623 Ack: 0x9637D2D2 Win: 0xFFFF TcpLen: 20

When we look at the packet content, here's what I get

2006-05-04 17:02:26.970419 00:0f:3d:a0:c9:a9 (oui Unknown) > 00:0c:41:92:56:ee (
oui Unknown), IPv4, length 511: 192.168.0.50.64276 > 202.75.42.254.http: tcp 457
0x0000: 000c 4192 56ee 000f 3da0 c9a9 0800 4500 ..A.V...=.....E.
0x0010: 01f1 4764 4000 4006 3b7f c0a8 0032 ca4b ..Gd@.@.;....2.K
0x0020: 2afe fb14 0050 da63 30fb a627 b2bd 5018 *....P.c0..'..P.
0x0030: ffff f869 0000 4745 5420 2f62 6967 7369 ...i..GET./bigsi
0x0040: 732f 636d 642e 6578 6520 4854 5450 2f31 s/cmd.exe.HTTP/1
0x0050: 2e31 0d0a 486f 7374 3a20 3230 322e 3735 .1..Host:.202.75
0x0060: 2e34 322e 3235 340d 0a55 7365 722d 4167 .42.254..User-Ag
0x0070: 656e 743a 204d 6f7a 696c 6c61 2f35 2e30 ent:.Mozilla/5.0
0x0080: 2028 5831 313b 2055 3b20 4672 6565 4253 .(X11;.U;.FreeBS

I supress the output, and the packet matches the rule. However what if I'm drunk and accidentally hit the caplock :P

http://202.75.42.254/bigsis/Cmd.exe

You may notice the cmd.exe changed to Cmd.exe and this time, only the default snort rule showing

[**] [1:1002:7] WEB-IIS cmd.exe access [**]
[Classification: Web Application Attack] [Priority: 1]
05/04-18:06:10.533189 192.168.0.50:64120 -> 202.75.42.254:80
TCP TTL:64 TOS:0x0 ID:20097 IpLen:20 DgmLen:497 DF
***AP*** Seq: 0xB89146AD Ack: 0x979C40E9 Win: 0xFFFF TcpLen: 20

The rule I write is bypassed, and if we examine the packet content -

2006-05-04 18:11:50.573240 00:0f:3d:a0:c9:a9 > 00:0c:41:92:56:ee, IPv4, length 5
11: 192.168.0.50.60670 > 202.75.42.254.80: tcp 457
0x0000: 000c 4192 56ee 000f 3da0 c9a9 0800 4500 ..A.V...=.....E.
0x0010: 01f1 4e9a 4000 4006 3449 c0a8 0032 ca4b ..N.@.@.4I...2.K
0x0020: 2afe ecfe 0050 7a06 b8bb aca1 254e 5018 *....Pz.....%NP.
0x0030: ffff 8612 0000 4745 5420 2f62 6967 7369 ......GET./bigsi
0x0040: 732f 436d 642e 6578 6520 4854 5450 2f31 s/Cmd.exe.HTTP/1
0x0050: 2e31 0d0a 486f 7374 3a20 3230 322e 3735 .1..Host:.202.75
0x0060: 2e34 322e 3235 340d 0a55 7365 722d 4167 .42.254..User-Ag
0x0070: 656e 743a 204d 6f7a 696c 6c61 2f35 2e30 ent:.Mozilla/5.0
0x0080: 2028 5831 313b 2055 3b20 4672 6565 4253 .(X11;.U;.FreeBS

The Cmd.exe turns out to be "43 6d 64 2e 65 78 65". The default rule which matching with case insensitive seems to be better choice in this situation, the hex value is good when we want to detect those non-printable data such as : which is 3a in hex value. This has been mentionned in this tutorial by Vorant.

Your idea of using hex value in this situation is bad since it is easily bypassed and you may need to write multiple rules if you want to detect cmd.exe, CMD.EXE, cMD.exe and etc. That's not a right way. I suggest for anyone who want to learn to write snort rule, for me the best reference is still Snort Manual where you can download from www.snort.org.

By the way, the hex value here has nothing to do with C/C++, you remind me of one CEH Conductor who tells me that the hex value has something to do with assembly language and you have to learn assembly language to understand it.

Sputera, I hope that helps.

Cheers (:])

Wednesday, May 03, 2006

Latest Sguil with PADS

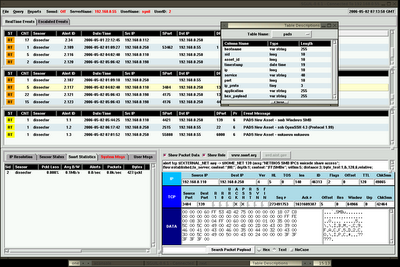
Thanks to Scottder and Bamm, I finally get Sguil with PADS working after some tries, it's a bit tricky at first but after some tinkering it is just work, my fault to bug Bamm and thanks for the reply. Here's the lovely screenshot and you may notice PADS in third pane of Sguil Analyst Console. One thing I found lacking would be the signatures of PADS, I will start to write some sigs and may contribute back since I'm using it. F34R the power of PADS .....


The pop-up menu shows the PADS table in the Sguil DB.

Peace :]

OpenBSD - Monitoring Network Interface

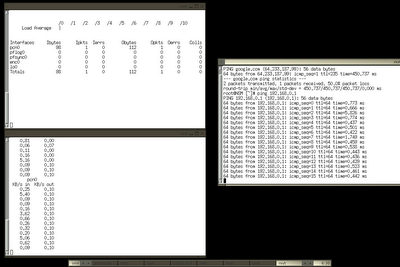
Sometime we need to monitor our network interface and having it's statistic shown in real time. If you are using OpenBSD, that's actually a nifty system tool to help you to monitor your network interface - systat, systat is used to monitor the system and showing it's statistic in real time. This nifty tool not only has capabilities such as monitor network interface but network stat(netstat) too, others such as disk usage and iostat can be monitored as well in real time. But here I just want to show how you can use it to monitor the network interface.

To monitor your network interface with 1 sec screen refresh rate, just run

shell>systat -w 1 ifstat 1


The first term shows the statistic of multiple network interface, the second one shows the bandwidth which I use the ifstat that installed from the OpenBSD package. Like I said, you can monitor netstat too, just run

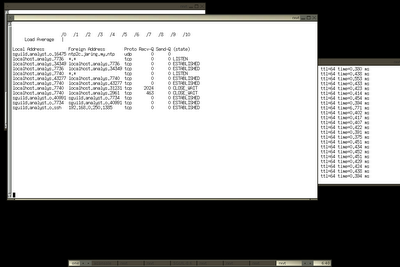
shell>systat netstat


I think monitoring netstat in real time is sweet because most people might find it useful especially the Send-Q and Recv-Q that showing you the current network statistic of certain port/services.

If you want to switch to monitor your swap or iostat, you don't have to quit, for example if you want to switch to monitor swap, just run : with any other statistic you want to monitor. For example,

:swap

Other statisitcs that can be tracked are iostat, vmstat and etc. To refresh the screen manually, just type Control+L will do or if you want to suspend the monitoring, just run Control+Z.

Enough for now, I need to work on my Sguil stuffs again, ciao.

Cheers (:])