Sunday, April 30, 2006

OpenBSD-3.9 + Sguil-???

I can't wait for sguil 0.6.+++ now, or maybe 0.7. The new feature where PADS is almost integrated empowering me to be the beta tester for it. However I have faced slightly problem and hopefully get it fixed soon.

For people who want to run Sguil on OpenBSD, good new is that every components that are part of Sguil are compiled successfully on OpenBSD 3.9 current, I can get tcl-8.4.13, tk-8.4.13 and even Mysqltcl-3.02 compiled and working fine. I'm rewriting my installation guide now while waiting for the next release of Sguil. Since making sguil installaition is what most people asking for, I'm on my way of creating it as well, I will just pack everything into the iso and let you decide what to install, most properly this way people no longer need to download the source manually but having everything in one iso is more efficient. Sguil client installation guide will be included in the installation guide for various OS such as Ubuntu Linux, Mac OS X, FreeBSD and OpenBSD.

Since most of the things get to compiled, I will be starting of working on Sguil OpenBSD port, but I will create one by one because of lacking time. If anyone want to help out, please email me on this part.

By the way, I also need to spend my free time on creating Linux Live CD for Mydefcon. Hands are full now but sharing with the world is what we should do.

For people who don't know what PADS is, check out

http://passive.sourceforge.net/

With passive asset detection system, Sguil is now one step ahead (:])

Peace .....

Saturday, April 29, 2006

the Handbook and the Training

I have mentioned previously about writing building network security analyst workstation handbook before, and yes I haven't get it finished yet because I'm thinking of integrating it to the book titled "Network Security Analyst Handbook". The book itself will demonstrate how you can use various kind of Open Source tools to perform network security analysis. Besides, it will demonstrate on how to build NSM and securing network stuffs. I will release it once I get it done.

Me and mel aka spoonfork will run 2 days tech training at HITB Conference 2006, you can check out the training detail here. Mel has also written a cool description about what will be taught through out the training which is interesting here.

Cheers :]

Thursday, April 27, 2006

MyCERT-SIG NSM presentation

Since there are people who want to have the quick download of my presentation slide, I have already uploaded it to here which is in pdf format. Thanks everyone for coming!

I will write a wrap-up for the topic that covered in the MyCERT-SIG-08 once I have time, travelling is kinda tiring especially you have to work in the next morning. Overall I enjoy the talk of other speakers as well and having meeting with all the myosser is kinda fun.

May see you all at Fosscar soon.

Monday, April 24, 2006

KL, I'm here now.

Finally I'm in KL now, preparing for the presentation tomorrow. However my pal - sickness decides to come with me as well, I hope I can get rid of him as soon as possible.

And now what? Most properly I will be going to meet myosser who is so alone, first guy to meet would be the m0nk-wannabe. Hopefully I don't see him botak.

I will write about network/bsd related stuffs once I get back and putting the presentation slide online, for the requests.

Cheers :]

Friday, April 21, 2006

Appreciate your healthiness

I'm not much into blogging recently, doctor says I should take some rest for being sicked. I have very bad headache and ulser that causing me hardly get my stuffs done. Working shift seems killing me especially night shift and I'm hardly recovered from the sickness.

On the other hand, I'm trying to finish my preparation for the myCERT KSS, hopefully I can get it done by today.

Peace :|

Sunday, April 16, 2006

Lame Mail Rotating Script

Yesterday nite when chit-chatting in #myoss, fellow in the channel - filex asking whether it is possible to rotate the email or maybe deleting the email every month, the quicky for sure is using cron job, however you are better to write a simple shell script to help yourself administrating the email. Here's the script -

#!/bin/sh

# Simple yet useful mail rotating script
# Written by geek00L [ 20060416 ]
# Revision
# None

maildir=/var/log/mail
backdir=/backup/mail

# Backup all the user's mail

cd $maildir

for i in `ls -1 $maildir`;
do
tar cvzf $i.tar.gz $i
mv $i.tar.gz $backdir
done

# HouseKeeping - Delete those files that haven't been accessed or modified for 30 days

find $maildir -type f \( -atime +30 -o -mtime +30 \) | xargs rm -rf

# EOF (:])

Remember to tweak maildir and backdir path. The find command will locate any 'inactive' mail and deleting it. Then just simply add this monthly cronjob will do.

30 1 1 * * root /pathto/mail-rotate.sh

I know this script is pretty lame, however hopefully that helps :P

Cheers :]

Saturday, April 15, 2006

Snort PortscanAI - testing

I have mentionned about snort portscanAI in previous post and start to configure it, here's how I get it to work.

The PortscanAI basically supports two type of neural networks - MLP and ELMAN, Multi-layer perceptron is feedforward and Elman is recurrent type. I have to admit I'm totally noob in neural network stuffs since I haven't had any experience in that field. For people who don't know what is neural network like me, you can take a quick glance at

http://www.willamette.edu/~gorr/classes/cs449/intro.html


http://en.wikipedia.org/wiki/Artificial_neural_networks


Since I have already have it installed, I prefer to have the report shown in web interface. In order to run it properly, few things need to be installed such as php-gd and php-jpgraph and a working apache.

shell>yum install php-gd.i386

Then I download php-jpgraph at here and install it with rpm -Uvh command. Later I create a directory to store the snort configuration file.

shell>mkdir /etc/snort/portscanAI

I didn't use /etc/snort because I may need to try out snort-spade later, that's the best way to run different instances of snort.

I extracted the snort-2.4.3_ai.tar.gz and copied the snort.conf from the snort-ai/etc directory that I extracted to /etc/snort/PortscanAI and tweak the following value to enable portscan-AI preprocessor

preprocessor portscanai: ignorebc 1 \
analyze_thr_lower 100 \
analyze_thr_upper 1600 \
sense_level 0.05 \
net_topology 0 \
log_method 1

preprocessor portscanai_train

You may need to read the config file to understand what those value meant if you want to tweak it. To enable it's web base analyze console, there's console_web under directory snort-ai, just copy the directory tesis which is under console_web to /var/www/html(apache root directory).

Then make changes to the following variables in /var/www/html/tesis/file/config.php

$log_path = '/var/log/snort/portscanai';

$jpgraph_path = '/var/www/jpgraph-1.17';

Since I install php-jgraph version 1.19, I just change jpgraph-1.17 to jpgraph-1.19

After everything is configured, just run

shell>/usr/local/bin/snort-AI/bin/ snort -i eth0 \
-c /etc/snort/portscanAI/snort.conf -l /var/log/snort &

Everything is running now, you may need to navigate the /var/log/snort to check for alerts and the data it logs in portscanAI directory. The dissapointing part for the web-gui are the Data Filter seems not working at all, and it is not fully in English, I suppose if the project want more beta tester, using international language is a must. I totally lost in reading the message(guess it's in spanish, my language knowledge is bad though).

Below are the screenshots .....

The main interface, the filter seems not working for me.

Even the indicator name I have to guess, destino == destination???


I don't understand what does this message meant, maybe google translator may help but it still a big faint to me, ouch!!!!!

Overall it is still fun to play with it since I have never touched neural network stuffs before, maybe people who have experience in neural network may find it useful.

Enjoy :]

IPgrab - High Level Protocol Analyzer

IPgrab - Claiming itself as a verbose packet sniffer, it provides a very clean overview of packet data. However I would prefer to call it as high level protocol analyzer since it is very effective especially to analyze the network traffic since it provides intuitive and human readable output.

IPgrab is no longer in development, and considered to be very old tool, you can find it's one and only manual at here. The manual itself hasn't showed much of it's usabilities so I take a chance here to demonstrate it. Never underestimate an old tool, it is very useful especially when ethereal/tethereal is not available. I didn't install IPgrab from source since it is available via FreeBSD package/port. To install it, simple make install or pkg_add -r will do.

To run it as sniffer, just type

shell>ipgrab -i vr0 -w ipgrab-blog.pcap
ipgrab 0.9.8
Listening on device vr0 (ethernet)
^C340 packets received
0 packets dropped by kernel
ARP: 0
IP: 0
ICMP: 0
IGMP: 0
UDP: 0
TCP: 0
IPX: 0
GRE: 0
IPv6: 0
ICMPv6: 0
OSPF: 0
RSVP: 0
AH: 0
ESP: 0

I try to ctrl+c to terminate it after I have gather enough packets to play with, however the statistic that showing none is actually no accurate, I'm still wondering why the output shows nothing however that's fine because I can read the pcap file later using ipgrab too.

To read the pcap file and get summary of protocol statistic, just run

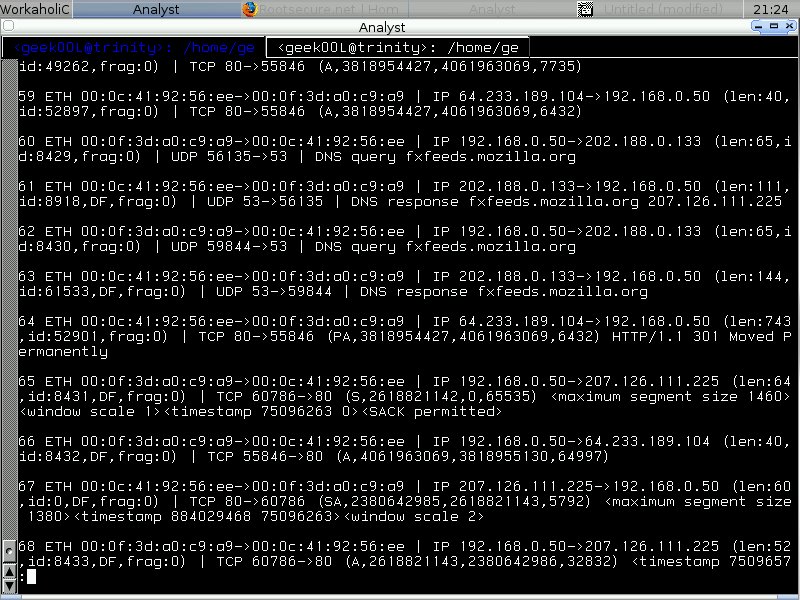
shell>ipgrab -lnta -r ipgrab-blog.pcap

You may find the output in the screenshot below.


IPgrab provides minimal and main mode, the minimal mode normally won't show every single field. It is more to quick viewing especially when you are doing testing. You can just run it with -m switch. You may find it is far more easy to read it's output than tcpdumps' with | separating each layer.


I don't think it is good idea to use IPgrab to capture traffic since you can't tweak much on the snap-length and it's default snap-length is 1514 which is actually enough for normal frame but what if you happens to have jumbo frame. That's why I think it is better to use IPgrab to perform protocol analysis. BPF filter can be used too however I'm covering it here and I think most people have enough with tcpdump :).

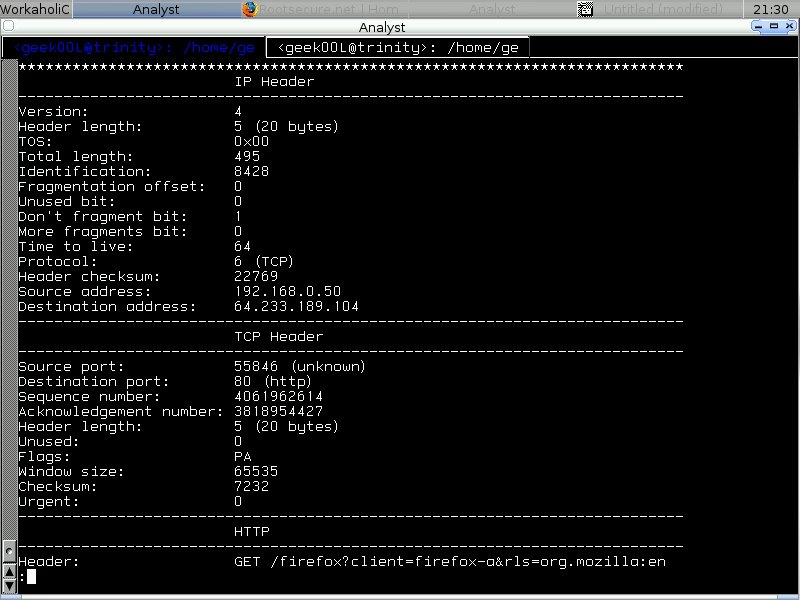
Here's the output of IPgrab when running in main mode(verbose), everything is so readable and in order.


Each packet is separated by the asterisk line and each layer is separated by the dash line. You can ignore any layer of data to be displayed by using different switch. Those are the switches I think is important.

-l ignore link layer

-n ignore network layer

-t ignore transport layer

-a ignore application layer

-p display unknown apps payload in hex

-x display hexdump of each field

-d dump padding if any exists

I ignore the link layer to be displayed by running

shell>ipgrab -l -r ipgrab-blog.pcap

You may see in the screenshot below that the packet shown started with layer 3 instead of layer 2 which is Network layer(IP) and go to Transport layer(TCP) next below it .....


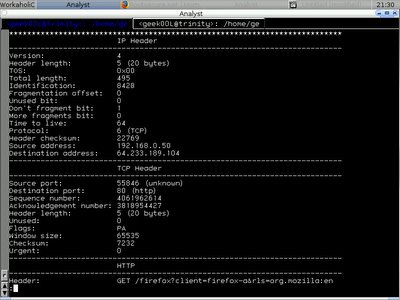
and at last application layer(HTTP) .....


To concentrate on Transport Layer Data in order to detecting anomaly transport layer header(TCP/UDP). You can pipe to less command so that you can navigate the output.

shell>ipgrab -lna -r ipgrab-blog.pcap | less


Maybe sometimes we need to locate all the source port, you can actually run

shell>ipgrab -lna -r ipgrab-blog.pcap | \
grep 'Source port' | awk '{ print $1, $2, $3 }'

Source port: 80
Source port: 59467
Source port: 80
Source port: 59467
Source port: 80
Source port: 80
Source port: 59467
Source port: 80
Source port: 59467
Source port: 59467
Source port: 59467
Source port: 80
Source port: 59467
Source port: 80
Source port: 59467
Source port: 80
Source port: 80
.....

If you are not quite satisfying with the output, you can run this to extend the visibilities of source port distribution,

shell>ipgrab -r ipgrab-blog.pcap | \
grep 'Source port' | awk '{ print $1, $2, $3 }' | \
sort | uniq -c

10 Source port: 137
2 Source port: 138
1 Source port: 49249
18 Source port: 50028
1 Source port: 50038
1 Source port: 50863
1 Source port: 51605
1 Source port: 52172
22 Source port: 53
1 Source port: 53517
17 Source port: 54021
1 Source port: 54133
1 Source port: 54205
6 Source port: 54422
1 Source port: 55034
1 Source port: 55588
4 Source port: 55846
1 Source port: 56135
1 Source port: 56410
1 Source port: 56633
1 Source port: 56747
4 Source port: 57207
1 Source port: 57697
1 Source port: 58065
1 Source port: 58118
15 Source port: 58129
23 Source port: 59467
1 Source port: 59844
5 Source port: 60786
1 Source port: 62755
1 Source port: 63354
1 Source port: 64651
1 Source port: 64815
1 Source port: 64935
99 Source port: 80

The number in the first field indicates how many times the port been used, for example port 80 was used 99 times.

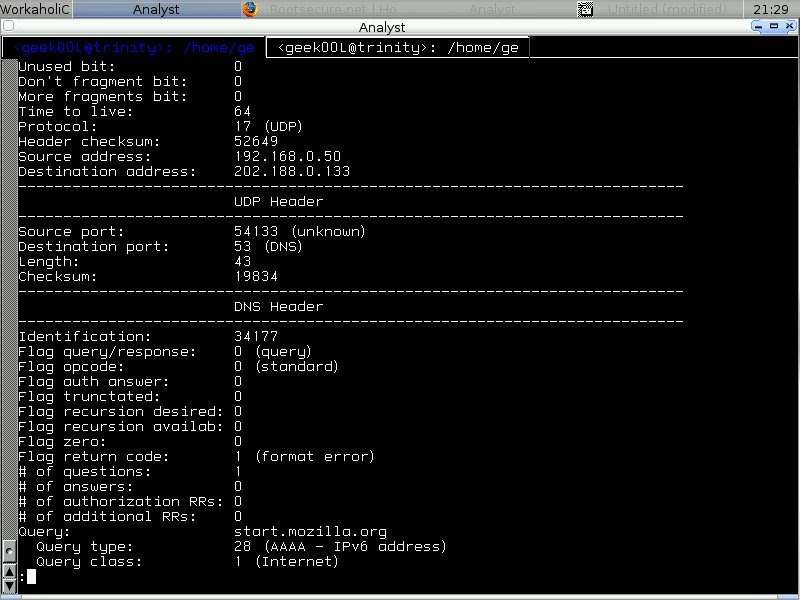
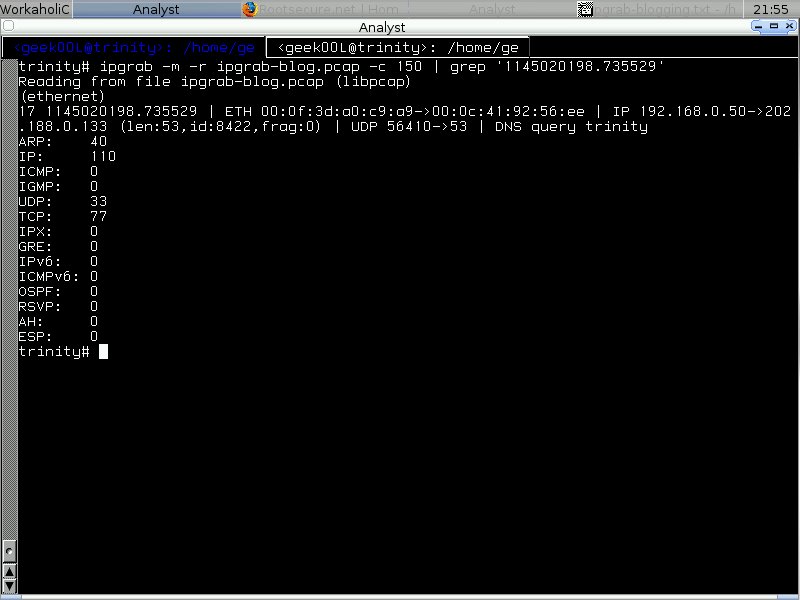
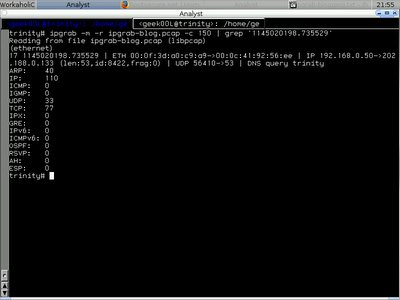
By default IPgrab will add the timestamp to the packet, so since it is unique number, we can use it to locate and search for the certain packet we want when we want to view it's content verbosely. Normally if running -r using main mode is killing since it might be wasting time if we have largest pcap file. So the best way should be running it in minimal mode when we need to navigate the packet and only view the packet of interest in full content data. Here's the trick to do it.

shell>ipgrab -m -r ipgrab-blog.pcap -c 150

For example packet we are interested in with timestamp of 1145020198.735529


Hence we run the command and pipe it to less

shell>ipgrab -r ipgrab-blog.pcap | less

Using less is very flexible, normally when you run the command and pipe it to less, you may see : at the last line of screen, you can search string by typing /, then type the string you want to
search (you may know this is vi alike stuff)

/1145020198.735529

Here's the screenshot for the packet with timestamp 1145020198.735529


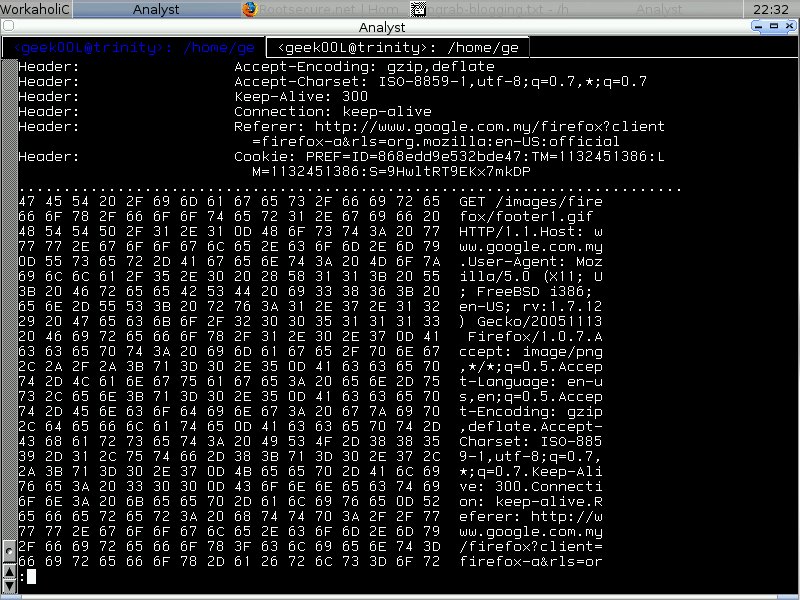
We can also oncentrate on Application Layer Data(If you are actually looking for pattern in application layer to write IDS signature). You need the data to be dump in hex format, just run ipgrab with -x switch. I ignore other layer here and only show application layer with -lnt switch.

shell>ipgrab -lnt -x -r ipgrab-blog.pcap -c 30 | less

DNS output(Hex|Ascii) -


HTTP output(Hex|Ascii) -


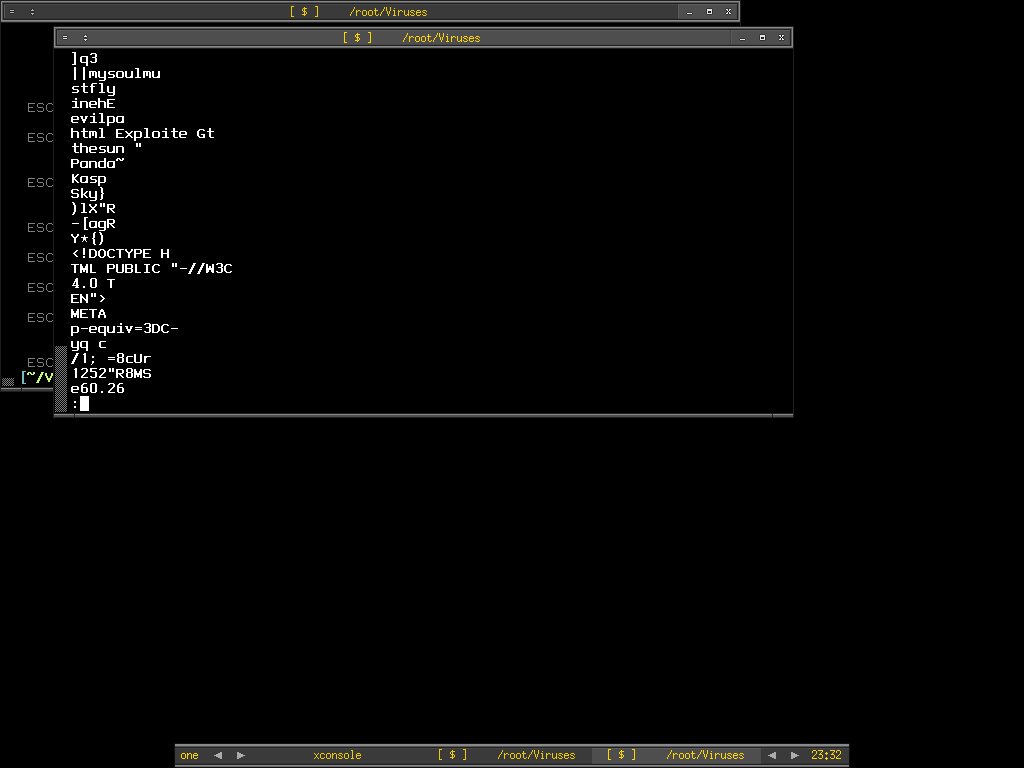
IPgrab is very flexible and versatile tool when we use it to analyze network traffic especially it decodes protocol pretty well. For protocol that it doesn't understand, it will just dump it in hex format, this is helpful since then we can use other tool such as tethereal to perform analysis when IPgrab doesn't understand it. There are many ways of using IPgrab yet to be discovered, however I think that's enough for now.

Cheers (:])

Friday, April 14, 2006

Snort and it's variant

I haven't been playing with any other snort variants lately after tinkering with snort clamAV. It's time to actually make a move to try out interesting stuff. I have heard about snort spade that used to detect anomaly traffics based on statiscal analysis a while ago, this project was revived and under active development currently. Another interesting project that inspired by snort is the one that adding preprocessor to detect the portscan using AI(neural), one of my friend is actually researching on Worm detection using neural network design so that might be helpful for his research work. You may find these two projects at

http://www.bleedingsnort.com/cgi-bin/viewcvs.cgi/?cvsroot=SPADE


http://afrodita.unicauca.edu.co/~aarboleda/snort_ai.htm

I try to compile both projects on CentOS and get it done in minutes since no errors at all. Then I take a look at snort-2.6 beta. After downloading the source through CVS, I just run sh autojunk.sh, usual configure, make and make install, it is installed fine. The only part I have tweak when configure is adding the prefix such as when I compiled snort-spade, I run

shell>./configure --prefix=/usr/local/bin/snort-spade

And for snort-AI

shell>./configure --prefix=/usr/local/bin/snort-AI

And lastly snort-2.6 Beta

shell>./configure --prefix=/usr/local/bin/snort-2.6B

Now I have three different kinds of snort binary in different directory and can try out any of them separately. I will try to compile it on OpenBSD once I have time.

Thursday, April 13, 2006

IPtables - Decent Tutorial

I have just learnt from the website on how to tweak the sysctl to prevent non-syn packet to start the tcp connect stream to connect. This is kinda useful where I don't need to load iptables rules in order to filter and reject such bad packets. I would like to share this url since I have never seen any IPtables tutorial as clean and clear as this which is free.

http://iptables-tutorial.frozentux.net/


To drop non-syn packet that starting tcp stream just run

shell>echo '0' > /proc/sys/net/ipv4/netfilter/ip_conntrack_tcp_loose

or

shell>sysctl -w ip_conntrack_tcp_loose=1

If you want to use IPtables to filter it, that's how it can be done, I didn't write the rule but copy and paste from the web tutorial because I'm afraid I may forget next time since I'm not frequent IPtables user.

shell>IPTABLES -A INPUT \
-p tcp ! --syn -m state --state NEW \
-j LOG --log-prefix "New not syn:"

shell>iptables -A INPUT \
-p tcp ! --syn -m state --state NEW -j DROP

Another important rule that can be applied is avoiding successful spoofing attack when receiving packets with syn+ack flags from the unknown host, reset should be sent to that unknown host that sending syn+ack packet, hence intruder can't simply take over the connection with it's own ack packet.

shell>iptables -N bad_tcp_packets

shell>iptables -A bad_tcp_packets \
-p tcp --tcp-flags SYN,ACK SYN,ACK \
-m state --state NEW -j REJECT --reject-with tcp-reset

I've actually read it quite sometimes ago, however tend to forget because of lacking practice on IPtables. Coming back to reading it is good for me since the tutorial seems more shiny than previously.

Enjoy :]

Wednesday, April 12, 2006

Trick To Trigger

The company I work with utilizing ticket based system, yet this is effective way to manage and handle customers since it is more interactive comparing to using email system alone. However this time, it is used by the hacker to try to perform social engineering to get around the firewall and compromising the network without much efforts.

Normally we allow customers to send attachment especially when they need to send screenshots such as ping or traceroute result. That may help to identify and fix client's issue. But allowing attachment seems not a good idea this time. The hacker was trying to trick the service support to open the attachment by sending this look so "INNOCENT" attachment.


I downloaded the attachment, and what starts to make me feel suspicious would be the attachment name is index.php after downloading it instead of the one shown in the ticket, this doesn't match at all. To identify the file type, I run the file command, and the file is uuencoded, if you don't know what is uuencoding, check the link here. Most to most it is unix to unix encoding and very popular in sending binary through email attachment these days.

I just decode it with uudecode that is installed by default in most of unix-like system, I redirect the output to fake after decoding. I recheck the filetype and apparently it is MS DOS executable.

I tried to run strings against the file, and it showed some clues to me what this file is all about especially this string - Exploite ...

Walking down the strings, we can already guess what this executable file trying to do, though port 80 for sure is good port to bypass firewall since most firewall implementation won't block inbound or outbound http. That may makes a good and stealthy backdoor indeed.

Sometimes it is not too hard to compromise enteprise network if you play around with the social engineering tricks especially when people have no idea what they are doing. Even security policy enforcement won't help sometimes if users are not aware enough.

Living with threats everyday .....

Peace :]

8th MyCERT-SIG KSS

I forwarded the message to my blog here since MyCERT asks for the favor. If you are working in the cyber security industry or would like to know more about the current threats, feel free to join the session. By the way, it is FREE.

Dear MyCERT List Members,

Regarding the above matter, we are glad to inform that the 8th MyCERT Special Interest Group Knowledge Sharing session will be held in this month.

Details of the session is as below:

Date : Tuesday, 25th April 2006
Time : 2 pm - 5.30 pm
Venue : Auditorium, Mimos Berhad, Technology Park Malaysia, Kuala Lumpur

More information on the 8th MyCERT Special Interest Group Knowledge Sharing Session including Speakers, Topics and Registration is available at:

http://www.mycert.org.my/mycert-sig/mycert-sig-08/

Please take this opportunity to register and attend the sessions to gain more knowledge in the field of ICT security. We also appreciate if you could extend the invitation to your colleagues and friends who could benefit from attending the sessions, offered free of charge.

You may find the agenda at

http://www.mycert.org.my/mycert-sig/mycert-sig-08/agenda.html

I will be presenting The Principle Of Network Security Monitoring[NSM] and see ya all there.

Cheers :)

Sunday, April 09, 2006

TcpXtract - AddON

Sunday should be the day to hang out? But I'm still sitting in front of computers after coming back from local PC fair. Reading seems to be my hobby these days especially keeping myself up to date with cyber security requires this kind of attitude, hoping I will stop this type of life when I'm old enough since I don't want brain damage.

Recent msdos executable and portable executable add on to tcpxtract config file works pretty well for me. Then I'm wondering is there a way to extract the elf binary, I decide to run either xxd or hexdump against elf binaries and studying it's header so that I can add it to tcpxtract.conf file. It's not trivial anywhere and this is what I append to the config file.

###############################
# ELF-execute &linking Format
###############################

elf(30000000, \x7F\x45\x4C\x46);

This is another piece I added for

###############################
# NE- new executable(used by windows)
###############################

ne(40000000, \x4D\x5A\x50, \x4E\x45);


For people who really want to understand about elf, this is one of must read -

http://www.cs.ucdavis.edu/~haungs/paper/node10.html

I found it very detail and clean in explaining about elf binary and it even helps me to understand the memgrep output that I have used when collecting hostile data on hacked server where I have it written here previously.

Peace :]

P/S: There are possibilities of generating false positive when extracting files because I haven't tested the signatures intensively.

Saturday, April 08, 2006

TIPS on HTTP Log Analysis

My daily job deals a lot with apache access log, as well as mod_security which is the IPS for apache. I start to realize that understanding http status code is important when analyzing web server's log. It may help you to understand whether the code executions, traffic redirection on your web server is successful or fail.

After googling, I get to this few links which I think it is useful resource especially to me. Sharing is always good, ain't it?

http://www.w3.org/Protocols/rfc2616/rfc2616-sec10.html

http://www.ilovejackdaniels.com/apache/http-status-codes-explained/

http://www.helpwithpcs.com/courses/html/html_http_status_codes.htm

I don't think I can memorize all of them, however remember one or two which are important might get yourself handy in analyzing log.

Enjoy :]

Friday, April 07, 2006

TcpXtract - Revisited

You may heard about tcpxtract before, either from somewhere in the internet or the good write up at taosecurity blog. The cool factor of Tcpxtract is the element X where it able to eXtract and reconstruct file based on it's header and format out of pcap dump. Nick Harbour, develope this nifty tool for the sake of network forensic.

I was using foremost, to extract the msdos executable file(brontok worm) out of pcap dump. I decide to give tcpxtract a try. However tcpxtract natively doesn't support msdos executable format. I quickly google to see if I can get any clue and I found this -

http://www.windowsitlibrary.com/Content/356/11/1.html

It is very old tutorial but decent and detail in explaining portable executable file format(PE). With a little knowledge of it, I add this to the tcpxtract configuration file - tcpxtract.conf. This is the part I like about tcpxtract - flexibilities, you can add whatever format when you learn one.

#####################
# Msdos-executable
#####################

exe(10000000, \x4d\x5a);

I didn't add this part but I think some people might find it useful, this is to add PE header.

#####################
# Portable-executable
#####################

pe(10000000, \x50\x45\x00\x00);

Then I start to run tcpxtract against brontok_pcap to see if I able to get the result I want. You might have to create the directory for it's output first.

shell>mkdir tcp_extract

shell>tcpxtract -f brontok_pcap -o tcp_extract/


shell> ls -la tcp_extract/*.exe
-rwx------ 1 root root 76092 Apr 7 07:18 tcp_extract/00000001.exe
-rwx------ 1 root root 64985 Apr 7 07:18 tcp_extract/00000002.exe
-rwx------ 1 root root 52253 Apr 7 07:18 tcp_extract/00000005.exe

shell> file tcp_extract/00000001.exe
tcp_extract/00000001.exe: MS-DOS executable (EXE)

Here's the content of 00000001.exe which is similar to what I get when I use foremost previously.


Tinkering with tcpxtract is fun (:])

P/S: adli, hopefully this is helping .....

My off days ...

I have 2-3 off days that I tried to away from internet, however I still can't get my hand off the keyboard since my notebook is with me. I choose to read about Securing Mysql Database, and trying out the graphical design application that recommended by Kaeru - Inkscape.

I ain't DB programmer and only a slight administrator of it, reading article about how to secure Mysql database helps me to understand the access control, priviledges and how to use grant and revoke efficiently. Since sguil is using Mysql as it's backend database, it might be useful when I understand more about the database I'm using. I have heard a lot of good things about PostgreSQL, but so far I haven't tried it yet and may take a look if I really have time.

About Inkscape, it is very powerful Open Source Graphical Drawing tool, you might be wondering why I learn this tool but it is real efficient and superb when you need a simple graphic design or maybe professional look design when you have already mastered it. I'm not a graphic designer, but you don't need to be one in order to get yourself handy on this application. It is user friendly, and providing various tools for you to draw, edit and paint, some say it is a bit of adobe illustrator, freehand and etc. If you are noob like me, I bet the tutorials that provided along with the application is what you should read, there are 5 of them and you can learn from the ground up in hours. Just click the help button on menu bar and there's tutorial in the drop down list and you can just click on it.

Here's the result ...


BTW, I don't own advertising company and I'm not fanboi of dell, this is just the picture that I think it's cool to share.

Cheers :]

Sunday, April 02, 2006

Spotting worms by analyzing session data

This maybe my last blog post about brontok as I think I had enough of it, I have just grab a copy of another brontok variant from my friend's network, coincidentally right after my post regarding brontok in last few days, lots of my friends calling me and telling that their "pc" infected by brontok. What I can say is that sorry I have no time to help you guys because I'm in busy state as well. Enough mumbling, back to the topic ....

This is not April Fool, yet I do like fooling people when I'm drunk or maybe being fooled .....

In the concept of Network Security Monitoring, collecting session data is a must. Though most people ignoring the role of it in security arsenal like I do few years back, but it is very useful when one involves in network security. There are few tools that considered in my favor list are ipaudit, argus and sancp which is used by Sguil project.

So how the hell session data will help in spotting worms? I will share a little knowledge of mine here. Before explaining about my finding, let's look at what is actually a computer worms. In wikipedia, a computer worm is a self-replicating computer program, similar to a computer virus. A virus attaches itself to, and becomes part of, another executable program; however, a worm is self-contained and does not need to be part of another program to propagate itself. They are often designed to exploit the file transmission capabilities found on many computers. The main difference between a computer virus and a worm is that a virus cannot propagate by itself whereas worms can. A worm uses a network to send copies of itself to other systems and it does so without any intervention. In general, worms harm the network and consume bandwidth, whereas viruses infect or corrupt files on a targeted computer. Viruses generally do not affect network performance, as their malicious activities are mostly confined within the target computer itself.

Computer worm replicates itself and try to propagate into or across the networks. Since it is written by human, it won't change by itself since it's behaviour has been predefined and programmed. Based on this fact, I believe that it is possible to spot worms by watching session data. Full content data needs to be collected if one want to analyze the payload, however the main point here is you may locate worms without even looking at anything by session data. I use brontok as experimental sampling. Here's what happen when I analyzed brontok inline with Sguil loaded in my VM at the same time. Snort generates alert on Netbios SMB Sessions. One of thing to be noticed is that the aggregate(CNT) of the event keeps increasing.


With sguil I can easily query the session data based on different criteria, below are the two screenshots that I have taken. If you have paid enough attention on source packet count and source bytes as well as destination packet bytes and destination bytes, you may find that the flow is always in the same sequence.


Here's the zoom in, so normally you will see the worm will try to ping(Pr equal to 1 which means ICMP and SPort + DPort = 0 since ICMP uses type and code instead of port) first to see if the host is alive and will try to connect to the IPC$ in order to access to victim's netbios share through port 139, and upload to the vulnerable host if there's any.


I generate the transcript of it with sguil, watching the conversation between them.


If I pull out the data using ethereal, everything will be much clearer and you may dissect everything that possible since ethereal is rich with it's decoder especially when you need to decode SMB/CIFS. However if you are analyzing it using tcpdump, you may need to run tcpdump with -vv option. Normally I use ethereal if I will have to examine full content data or learning protocols that I don't really much deal with.


My main point here is if you notice or catch session data that goes with same sequence especially it's src packet count and length as well as dst packet count and length are always the same, then most properly your network is parasited by worm or it is in the wild. Computer worms normally has no intelligence to deal with this kind of detection since this is not signature base. One may consider writing worm that spreading with random junk data padded in the payload to confuse the security analyzt however that will only change the src packet bytes but dst packet bytes will still be the same since it is not controlled by worm. Another thing is the time interval may reveal the worms too because normally computer worm is built to spread in certain time period and not randomizing. Everything seems to be logical.

I really appreciate the value of session data not to say it is cheap to store but it is neutral to any kind of connection whether it is encrypted or not, as long as we records the connection pairs, we can learn and evaluate it later. Flow pattern tracking is real good in worm detection.

The screen below is not related to the title, I post it because someone ask me who is the papa of brontok, so here you have it.


Though nowadays worm mostly getting through by email because they know human is the easiest to be cheated since there's no human firewall where cyber security is hardly taught and delivered. However flow pattern assessment is effective enough to detect worms in the LAN.

Just my little 2 cents, peace (:])

P/S: toxicle, I hope this is not april fool thingy :P, http://mydefcon.org .....

Saturday, April 01, 2006

OpenIDS

BASE - Basic Analysis and Security Engine gains popularities among Open Source Community. I think it is because of it's predecessor - ACID and the ease of installation. However when I try to look for any Installation Guide of BASE on OpenBSD, I can't find a good one. Until I accidentally hit this URL due to it's project name with Open as prefix - http://www.prowling.nu. It is the main site for OpenIDS project where it is mainly based on OpenBSD and BASE.

I don't think I will change my mind to use BASE instead of Sguil, however OpenIDS is worth mentionning here since it eases the installation and management of IDS. As well it may help people who have hard time to install BASE on OpenBSD. By the way, no harm trying .....

Other features that caught my eyes would be pfw/hatchet(PF Web Console) and Snortalog are integrated into OpenIDS as well. If anyone interested in trying out OpenIDS, just download it from the mirror link in the download page.

Keep up the good work :]

P/S: I would prefer if anyone write a generic Base Installation Guide on OpenBSD or anyone can point me to one if there's any.