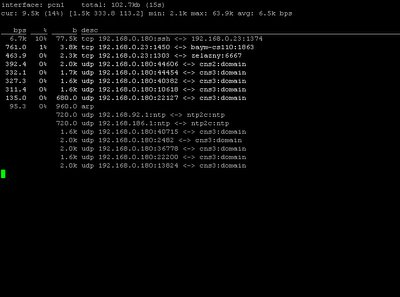
I have found a interesting tool to monitor the network interface in the OpenBSD port recently - pktstat. The pktstat program displays a real-time summary of packet activity on an interface and maybe you are thinking of tools like ifstat and etc, however pktstat has it's own interesting features that not offered by other tool, let's check it out.
After finish the installation via package, I quickly run pktstat on my NIC - pcn1. By default pktstat shows bit per second statistic of the interface. However you can force it to show bytes per second by running,
shell>pktstat -B -i pcn1
or showing packets per second
shell>pktstat -p -i pcn1
I can just show total traffic on the fly by using -T switch,
shell>pktstat -T -i pcn1

Another reason I like about it would be the bpf filter, you can specify it to suit your needs and what connections statistic you want to watch and etc through the bpf filter. I just run
shell>pktstat -i pcn1 tcp

To view only udp connection statistics,
shell>pktstat -i pcn1 udp

I feel that pktstat is pretty neat tool to monitor the network interface, you can actually use it effectively to detect DOS attack or maybe network compromised. Few interesting stuffs you can do such as showing the flows from and to the network with 192.168.0.0/24 with the command
shell>pktstat -B -n -i pcn1 net 192.168.0.0/24
as well as showing the hosts that sending tcp packet contains syn flag.
shell>pktstat -c -i pcn1 tcp[13]==2
The best part is that it is flexible and you can toggle it to change the mode such as pressing T key to get into total mode and all. Changing mode on the fly is good where you don't have to retype the commands to show the output you want. You can play with the Abbreviation patterns for further combining flows. The Abbreviation file can be used through -A switch in command line and below are the example of abbreviation that I have taken from man page
dns @ udp *:domain <-> *
dns @ udp * <-> *:domain
irc @ udp 192.168.0.81:6666 <-> *
www @ tcp 192.168.0.23:80 <-> *
The last one I have added myself and I guess it's not hard to figure out how to write the abbreviation file. Pktstat by default searches the ~/.pktstatrc or specify in /etc/pktstatrc. You can suppress it by supplying -A none option.
Monitoring with pktstat on the fly (:])
Monitoring with pktstat on the fly (:])

No comments:
Post a Comment