Monday, November 27, 2006

More weird packets, please!

This is kinda old stuff, but it is very interesting, at least to me -

http://lcamtuf.coredump.cx/mobp/

Maybe that's why we need openpacket.org! If you have weird packets that considered tricky and unique to resolve, please share with the world.

Cheers :P

Sunday, November 26, 2006

Nice Blog

I come across this blog accidentally when googling. I think it is interesting though, share with everyone indeed -

http://hhi.corecom.com/weblogindex.htm

Don't miss out his publications as well!

Enjoy :]

Tuesday, November 21, 2006

ArgusEye

I think there are people who love graphical user interface, now there's simple and lightweight interface for argus client - arguseye. It is still very young but I can see more potentials in future development.

You can probably grab it @

http://www.uni-koblenz.de/~phil/arguseye/

Here's the screenshot -


It is very simple to use, just open argus file that you collected from your passive monitoring device, and load it. You can define the filter expressions(bpf like) to extract the flow data that you are interested to examine. You can also change the column placement and data to display by editing the display field. You able to sort the field(column) as well such as source port, destination port and etc by clicking on the field tab.

The colors in the interface can be tuned since it is written using perl/GTK. I would like to see active development in this tool such as supporting more argus client tools like racluster, rasplit and so forth.

Credit goes to Phil who has developed almost the first GUI(I can't find any GUI Frontend that supports Argus 3.x yet).

Enjoy :]

P/S: Argus 3 is almost out, most probably before end of this year!

Language tutorial

Sometimes you can't resist to learn new language, I'm not talking about programming but human languages here in case someone think I'm too geeky. Learning is a process so I will learn small sum at a time.

So what have I learned today? Probably Portuguese language ...

Network protocols = poritas de rede
Network ports = portos de rede

Maybe I should learn the fundamental instead of jumping into network terms, but why should I?

I've told you I'm not geeky enough!!!!!

Enjoy ;P

Monday, November 20, 2006

MyCERT Abuse Statistic

Based on the report, I don't know how things are categorized, can someone shade some lights?

http://www.mycert.org/abuse-stat/index.html

It seriously looks confusing isn't it, hack threat, malicious codes, harassment, intrusion? Do you consider network scanning as hack threat or harassment, and malicious codes itself can't abuse unless it is used by party with purpose or intention.

Can each category be defined in more transparency and clearer sense?

I'm not drunken master when I'm writing this. MyCERT, please rethink about it, I know you can do better than that!

Cheers :]

Sunday, November 19, 2006

File System Full

I'm running into very funny problem where my /var file system is full, I observe this while looking at my log -

Dec 11 18:59:17 trinity /bsd: uid 0 on /var: file system full
Dec 11 18:59:41 trinity last message repeated 21 times
Dec 11 19:00:14 trinity /bsd: uid 0 on /var: file system full
Dec 11 19:00:14 trinity pflogd[26078]: Logging suspended: fwrite: No space left
on device

I run df -h to check it,

Filesystem Size Used Avail Capacity Mounted on
/dev/wd0a 251M 43.4M 195M 18% /
/dev/wd0f 126M 22.0K 120M 0% /home
/dev/wd0h 11.5G 1.2G 9.7G 11% /nsm
/dev/wd0d 126M 6.0K 120M 0% /tmp
/dev/wd0g 5.9G 2.7G 2.9G 48% /usr
/dev/wd0e 502M 501M -24.2M 105% /var

I figure out that I have really big log file - pflog which is around 400MB under /var/log, thus I remove it. I try to check /var again with following command -

shell>du -sh /var
100M /var

That's cool, I think I have reclaim the space I need, but I can't log anything to /var due to file system full even after removing pflog. It seems odd to me, I try to recheck again -

shell>df -h
Filesystem Size Used Avail Capacity Mounted on
/dev/wd0a 251M 43.4M 195M 18% /
/dev/wd0f 126M 22.0K 120M 0% /home
/dev/wd0h 11.5G 1.2G 9.7G 11% /nsm
/dev/wd0d 126M 6.0K 120M 0% /tmp
/dev/wd0g 5.9G 2.7G 2.9G 48% /usr
/dev/wd0e 502M 501M -24.2M 105% /var

It still shows the same thing, I can't think of why df is still showing the same result and it doesn't allow me to even create a file under /var. My only solution should be a "Reboot", since giving it a try do no harms, I rebooted my machine.

I run df -h again after system is rebooted -

Filesystem Size Used Avail Capacity Mounted on
/dev/wd0a 251M 43.4M 195M 18% /
/dev/wd0f 126M 22.0K 120M 0% /home
/dev/wd0h 11.5G 1.2G 9.7G 11% /nsm
/dev/wd0d 126M 6.0K 120M 0% /tmp
/dev/wd0g 5.9G 2.7G 2.9G 48% /usr
/dev/wd0e 502M 104M 373M 22% /var

Now it looks fine, but why does it need reboot to reclaim back the disk space? Pretty odd it seems on my OpenBSD 4.0 box.

Enjoy (:()

Thursday, November 16, 2006

Time Machine - Payload Centric

I don't think NSM is the only approach that appreciate the value of full content data, Bro-ids Community do believe and identify that full content data is important when one needs to perform network forensic and analysis, by travelling back to the incident scene with their time machine.

However, full content data collection is a problem when comes to implementation due to some limitations, again Bro-ids community tries to solve the problem with their innovative ideas. Since it is already well mentioned in the link below, I won't be mentioning it here -

http://www.net.t-labs.tu-berlin.de/research/tm/#doc

They have developed the tool called time machine where you can download from their site, I'm pretty interested to run it using my testing server as they state that time machine runs well on gigabits network. I remember I have packets drop when using other network based tools to log the packets.

I'm using FreeBSD as my platform for the setup, I untar the source after downloading it, the installation runs fine with ./configure and make, the developers of time machine encourage users to run time machine from the same directory you compile the source code.

It seems to be trivial at first but you will definitely get clearer picture after reading the how-to. I just configure the file - tm.conf before running tm. Here's my config -

# Example TM configuration file
# $Id: tm.conf 107 2006-11-11 03:11:40Z gregor $

main {
logfile "tm.log";
# these directories must exist when tm starts!
workdir "/nsm/tm/";
indexdir "indexes/";
queryfiledir "queries/";

log_interval 10;
device "fxp1";
# read_tracefile "trace.pcap";
# filter "not port 80";
# bro_connect_str "localhost:47757";
console 1;
conn_timeout 180;
rmtconsole 1;
rmtconsole_port 42042; # 42042 is default
rmtconsole_listen_addr 127.0.0.1; # 127.0.0.1 is default

}

class "all" {
filter "";
precedence 5;
cutoff 15k;
disk 50g;
filesize 1000m;
mem 300M;
pkts_to_disk 2;
}

I need to create few directories before running tm, the pcap log will archive by itself after reaching 1GB(1000m). The network interface that I'm monitoring is fxp1. You can tweak the cutoff value based on your need. I don't set any bpf filter as I want full content data.

shell>mkdir -p /nsm/tm/indexes
shell>mkdir /nsm/tm/queries

Now I just need to execute

shell>./tm -c ./tm.conf
timemachine version 20061111-0
capture started
CLI console thread started
tm@testing.org#

I navigate /nsm/tm and the pcap is logged properly, most importantly there's no packets loss, here's some of the entries in my log - /nsm/tm/tm.log

shell>cat /nsm/tm/tm.log
1163664440.846803 stats: 46061451/0 recvd/dropd P (0.00) 46061371 Pkts, 32689159206 B, 58.6 Mbit/s
1163664440.847054 class_all: 3978554364 11891524 28708322158 34132765 300526337 877840 1163663733.592655 3854246971 11013684 1163654237.963090
1163664440.847312 stats_conns: 36781 conns

shell>ls -la /nsm/tm
total 4126504
drwxr-xr-x 4 root sguil 512 Nov 16 16:20 .
drwxr-xr-x 18 sguil sguil 1024 Nov 16 13:17 ..
-rw-r--r-- 1 root sguil 1048575623 Nov 16 14:15 class_all_00000001
-rw-r--r-- 1 root sguil 1048575410 Nov 16 14:57 class_all_00000002
-rw-r--r-- 1 root sguil 1048574833 Nov 16 15:40 class_all_00000003
-rw-r--r-- 1 root sguil 1048575974 Nov 16 16:20 class_all_00000004
-rw-r--r-- 1 root sguil 28655616 Nov 16 16:21 class_all_00000005
drwxr-xr-x 2 root sguil 1536 Nov 16 16:04 indexes
drwxr-xr-x 2 root sguil 512 Nov 16 12:38 queries
-rw-r--r-- 1 root sguil 368285 Nov 16 16:21 tm.log

I run bpfstat as well and apparently there's no packets drop so far. I'm currently running the time machine for few days to test it. Maybe I will perform stress testing when I have time.

Time machine is aimed to solve the storage and performance issue while retaining the all possibilities to perform network forensic and analysis functions. At the moment the communication of time machine with bro-ids is done via brocolli and they will integrate time machine into bro-ids in future.

I'm sured time machine is one of efficient option available for you to collect full content data. We have already seen many protocol header centric solutions - netflow, argus and etc, time machine is packet payload centric instead.

Enjoy (:])

Qcow -> Vmdk

I have created the qemu image using qcow format, while I have promised to create image for VMware users, you can actually do this by yourself without waiting for my new image(with Sguil Current). Qemu offers you a tool to convert the image format. You can do this via -

shell>qemu-img convert -f qcow OpenNSM.img -O vmdk OpenNSM.vmdk

Now you should be able to load the converted image to VMware. Thanks to lightstar who point me out.

Cheers :]

Monday, November 13, 2006

OpenBSD Darkstat

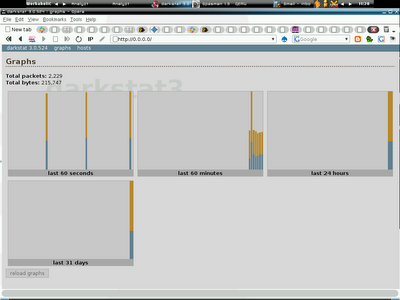
Darkstat is network statistic collection tool, and it works pretty well with ppp, I have been using pppoe that supported by Screamyx and I would like to collect statistic from it. Darkstat package is available for OpenBSD so installation is not much issue, I just need to execute it after installation.

shell>darkstat -i tun0 -p 80 -d

By default darkstat binds to any available interfaces and you can specify it if you want, I don't do so as this is just for testing and I just wanna see if it works. After running it and getting it listen on port 80, I just open my browser and the traffic graphs are shown.


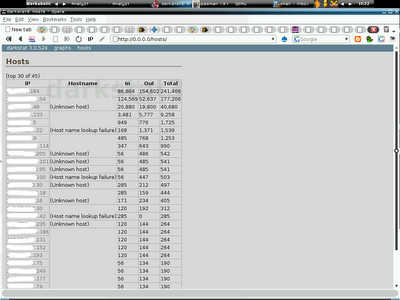
It also has collected traffic statistics per host, you can examine each host and understand what ports and services are used by specific host when needed.


If you want to be more specific when collecting network statistic, just use its filter expression such with -f argument will do. By default darkstat doesn't offer any access control so using .htaccess to protect the information is what you can do for the moment.

Enjoy ;]

Sguil - Tips of Da Day

Someone is asking me about Sguil, and he raises interesting question - I know you can use Sguil to retrieve most of the data you want as you have collected it in all forms that you need to perform your analysis process. But what if I have to monitor heavy load networks(gigabits) where the data transfer is tremendous(WAN environment perhaps)?

The first thing I can really think of should be bpf filtering, reducing noise and collecting what you really need is important and it can lighten your workload and reduce your analysis time, but yet you are afraid of missing the traffics you may want badly.

Bpf filtering is not your only solution, if you still want to run sguil in heavy loads network, you can reduce the visibility level by discarding the full content data logging, however you are not much into worry as you still have session/flow data that available in hand which allows you to perform analysis and understand the connections between source and destination host.

So everything is about log_packets.sh that comes with sguil source tarball. You can either choose to tune the bpf filtering or not running it when you don't have enough disk storage for full content data. It may eliminate some functions in Sguil but you are still able to perform the necessary steps to monitor your network security in high speed network.

So whoever think that Sguil can't survive big networks - rethink about it!

Cheers (;])

Tuesday, November 07, 2006

Sguil Qemu Image: Corrections

I just realized that I have done a stupid mistake where I have this one liner in /etc/hostname.ne3 -

inet 192.168.0.248 255.255.255.0 none

It is supposed to be NONE instead of none, I have smaller letters in the file and it should be changed, sorry for any inconvinience. Once you change it, either running -

shell>sh /etc/netstart

Or rebooting and the network will work by now if you are in 192.168.0./24 network. The other thing that need to be done should be the net-config.sh script under /root/nsm-scripts, please change it as well if you want the network configuration can be done via script instead of manual configuration. in fact my silly error is due to not testing the net-config.sh script enough before delivering the image.

Cheers :]

Monday, November 06, 2006

PgOSS - Call For Helps

I'm busy and need some helping hands on the next PgOSS Meetup, while surface and aizat can't be around. If any of you interested in organizing PgOSS Meetup, please do email me. I have received few emails from the people who are interested in the Meetup but so far what I need is people who can help in making the meetup running smooth for every month(monthly meetup event).

We need to properly push on Penang Island to create awareness about OSS, please let me know as soon as possible if you would like to help.

Thanks :]

OpenNSM Released

Finally it is done, the OpenBSD + Sguil Qemu Virtual Appliance, I named it OpenNSM, this is the first initial version and feel free to try out. The image size is around 920MB but has been compressed to 210MB with bzip, the image should be pretty smaller and lesser than 920MB, however since it is qcow format that can grow but not reducing the size even if you deleted the files in the image, thus it remains around 1GB size, and that also explains why the compression rate is so significant. If you like the virtual appliance, just donate me a thank will do. OpenBSD 4.0 Release and Sguil-0.6.0p1 are the main core of this virtual appliance so if you would like to try out OpenBSD 4.0 Release, this is one of good chance to try without installation as well.

The virtual appliance is available here -

http://www.dissectible.org/anonymous/OpenNSM/OpenNSM.tar.bz2

You can find the README on how to use OpenNSM virtual appliance here -

http://www.dissectible.org/anonymous/OpenNSM/README

So far I have tested it and it is pretty stable for me on my FreeBSD workstation. As usual if you are running into any problems or you have any suggestions regarding OpenNSM, feel free to email me - geek00L [at] gmail[dot] kom

The VMware version of OpenNSM will be released when I have time, cheers.

Enjoy (;])

Sunday, November 05, 2006

OpenNSM Qemu Virtual Appliance

Long time I haven't had uploaded any screenshots to my blog, here are 3 screenshots from my OpenBSD + Sguil qemu virtual appliance before releases. Seriously I don't know how many qemu users out there(I guess not as many as vmware, however I still believe qemu makes a good alternative and pretty good for bsd users).

The OpenBSD XDM Login Screen

Choosing sguil sensor .....

Sguil Analyzt Console

The release is pretty soon!!!!!

Cheers :]

Saturday, November 04, 2006

FreeBSD Network Tap & Sguil Virtual Appliance

Follow up the OpenBSD Network Tap, I have added the section on NSM wiki for FreeBSD Network Tap after my testing on it. You can find the quick setup here -

http://www.vorant.com/nsmwiki/index.php?title=FreeBSD_Network_Tap

By the way, my OpenBSD 4.0 + sguil qemu virtual appliance is almost done inline with the setup guide will be released around next week. For people who prefer VMware virtual appliance(I know most people do), I have delayed the release of it as my Ubuntu system crashes after upgraded to the latest version(edgy) and now I need to fix it before I can run vmplayer.

Thanks to nikns who has ported sguil to OpenBSD which seriously improves the sguil installation experience. I think latvian rox :P

Cheers :]

Wednesday, November 01, 2006

OpenBSD Network Tap

Most of the time I like to write something useful in my blog here, however I choose to contribute to NSM wiki as I always love to have everything in one place. Hopefully more and more people will contribute to the wiki and improve its contents.

Since I'm lazy to write it twice to avoid overlapping content, you can find how to setup OpenBSD box as transparent Network Tap at the link below -

http://www.vorant.com/nsmwiki/index.php?title=OpenBSD_Network_Tap

With this setup you can distribute the network traffics to dedicated traffic collectors or sensors. This is always much preferred in enterprise environment.

Cheers (;])

OpenBSD 4.0 Released


OpenBSD team creates new milestone again, after heavy development and testing from the communities, 4.0 is finally released. Greet to all of the people out there who makes it successful.

I'm pretty stunned with all the improvements and features that been added to this release, check it out here.

Lets rock with the puffy, enjoy :]