Using ttt(tele traffic tapper), tcptrace and xplot, you will be able to read network traffic in graphical view, especially ttt, it able to break up the protocols and summarizes each protocol, and showing the progress of traffic running when you load the pcap file. Tcptrace able to produce different type of output containing information on each connection seen, sounds like tcpflow right, however it also allows you to export the data to graphical output by using -G argument. The only weak point is that tcptrace can't play with udp and icmp packet. One really good thing about tcptrace is that it has very complete documentation that makes you familiar with it, hence it makes you troubleshooting network problem effectively. Xplot is the tool used to create and view useful graph for analyst, it plays well with tcpdump and if you have time, take a look at tcpdump2xplot.
Before I forget, a little new to tell, sguil-0.6.0 rc2 released, I'm happy because finally it moves to more mature stage.
Here I will show a demonstration on how to use ttt, tcptrace and xplot to load and view the intrusion traffic graphically.
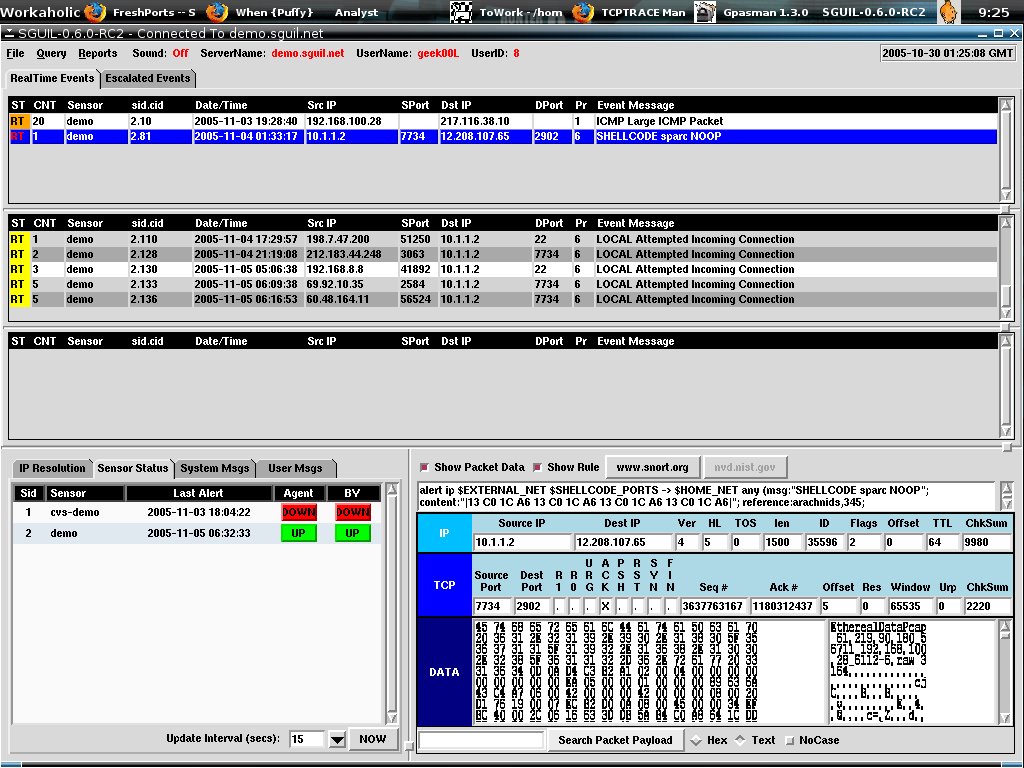
At first I log in to the Sguil Analyst Console, and check out blue color highlighted line(second line in first pane), I load it to ethereal by right clicking on it's sid.cid(2.81).
Before I forget, a little new to tell, sguil-0.6.0 rc2 released, I'm happy because finally it moves to more mature stage.
Here I will show a demonstration on how to use ttt, tcptrace and xplot to load and view the intrusion traffic graphically.
At first I log in to the Sguil Analyst Console, and check out blue color highlighted line(second line in first pane), I load it to ethereal by right clicking on it's sid.cid(2.81).
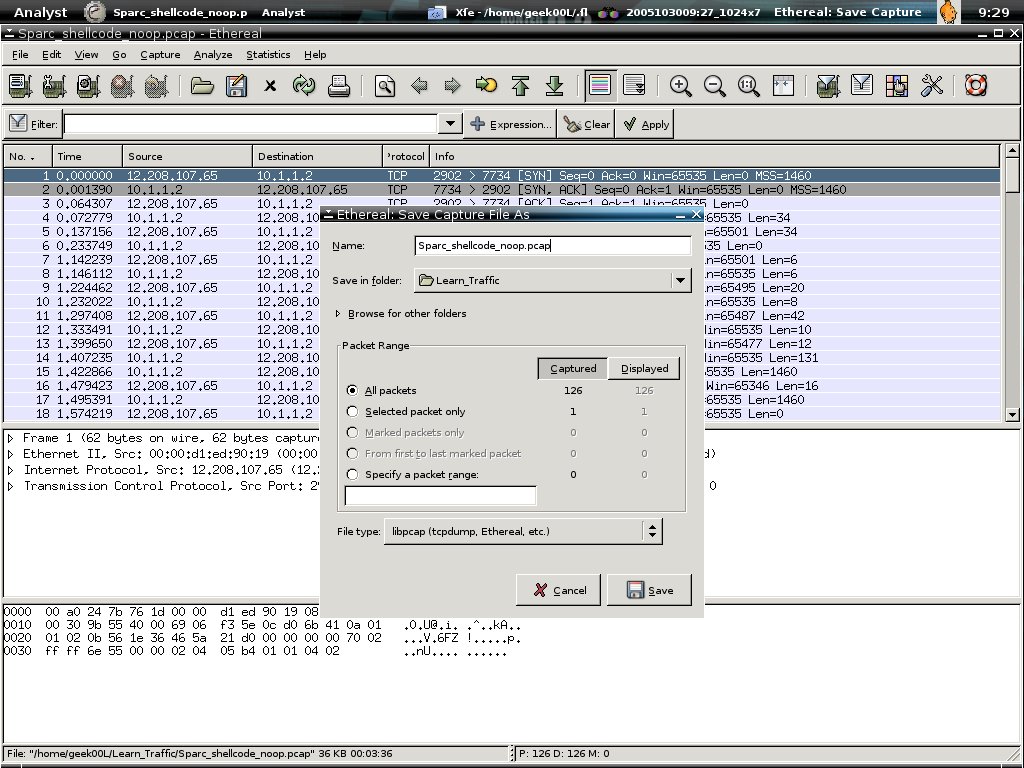
So you are downloading the raw file(pcap formatted) and load it to ethereal.

Here's how the network traffic shown in ethereal.

You can now either go to File->Save as-> to save the pcap file, or just shift+ctrl+s to save it, I personally save it as Sparc_shellcode_noop.pcap under /home/geek00L/Learn_traffic directory.
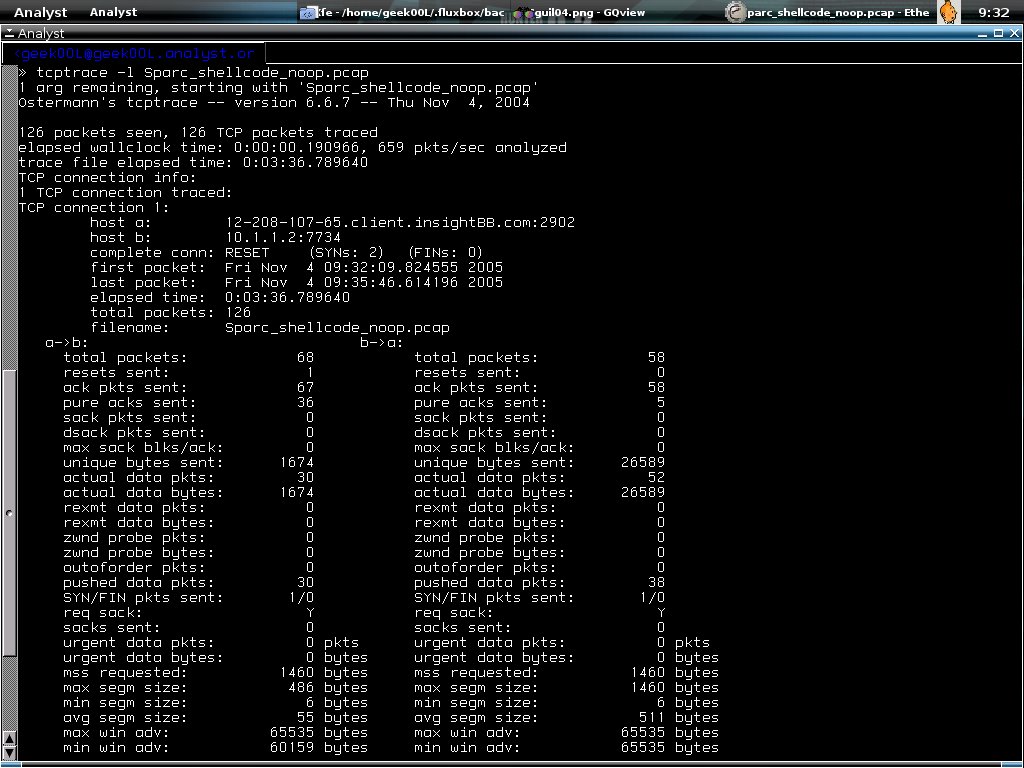
Now I start my mrxvt terminal and launch tcptrace,
shell>tcptrace -l Sparc_shellcode_noop.pcap
The result is shown in the screenshot below, it shows all the useful information, the -l shows long output which is similar to verbose mode for other tools.
shell>tcptrace -l Sparc_shellcode_noop.pcap
The result is shown in the screenshot below, it shows all the useful information, the -l shows long output which is similar to verbose mode for other tools.
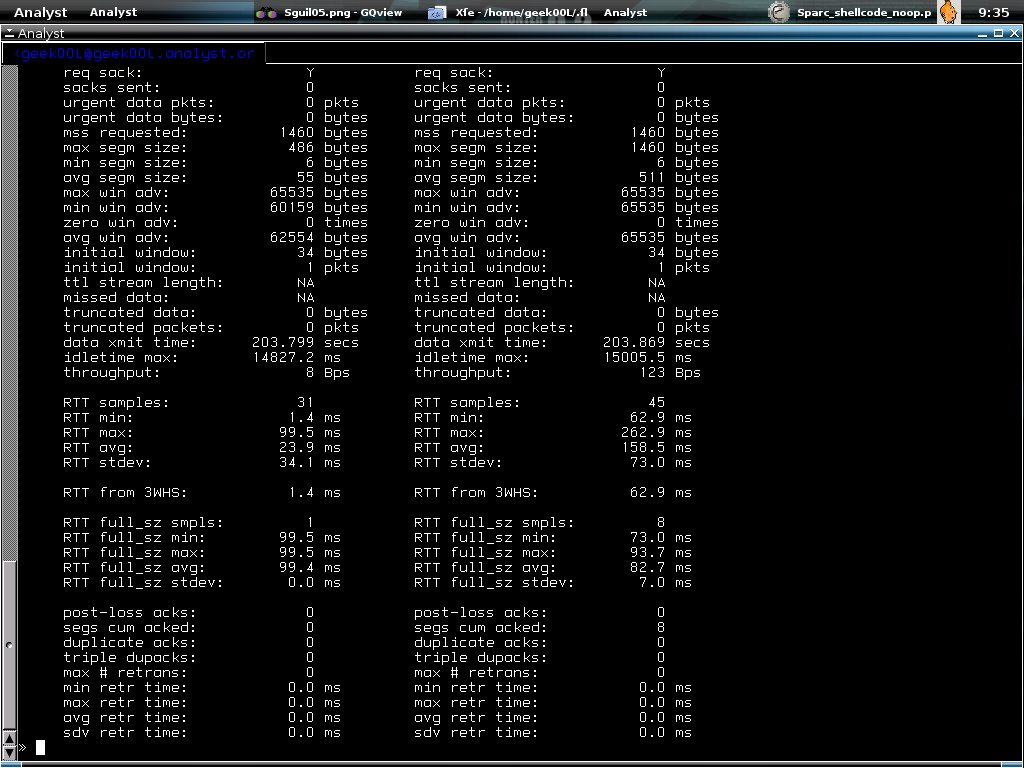
Shell>tcptrace -lr Sparc_shellcode_noop.pcap
With -r it will even summarize the round trip time information. This is good for network troubleshooting isn't it?
With -r it will even summarize the round trip time information. This is good for network troubleshooting isn't it?
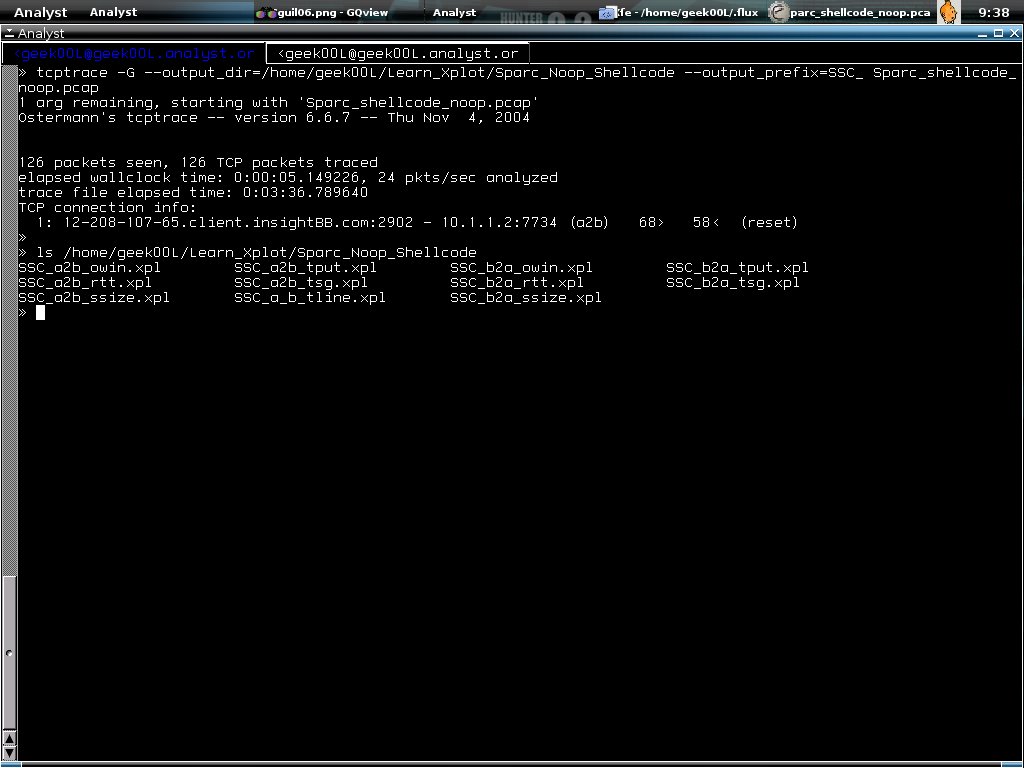
Building graphs for the pcap data is easy with tcptrace, just use the commands below,
A little explanation for the command line above, -G is for all type of graph building, --output_dir means to which directory it sends the output, and --output_prefix is useful because you can specify it's prefix for each output file so that we won't mix out all different traffics. The output files are all in xpl format of which you can view it using xplot.
Shell>tcptrace -G --output_dir= ~/Learn_Xplot/ Sparc_Noop_Shellcode --output_prefix= SSC_ \ Sparc_shellcode_noop.pcap
A little explanation for the command line above, -G is for all type of graph building, --output_dir means to which directory it sends the output, and --output_prefix is useful because you can specify it's prefix for each output file so that we won't mix out all different traffics. The output files are all in xpl format of which you can view it using xplot.
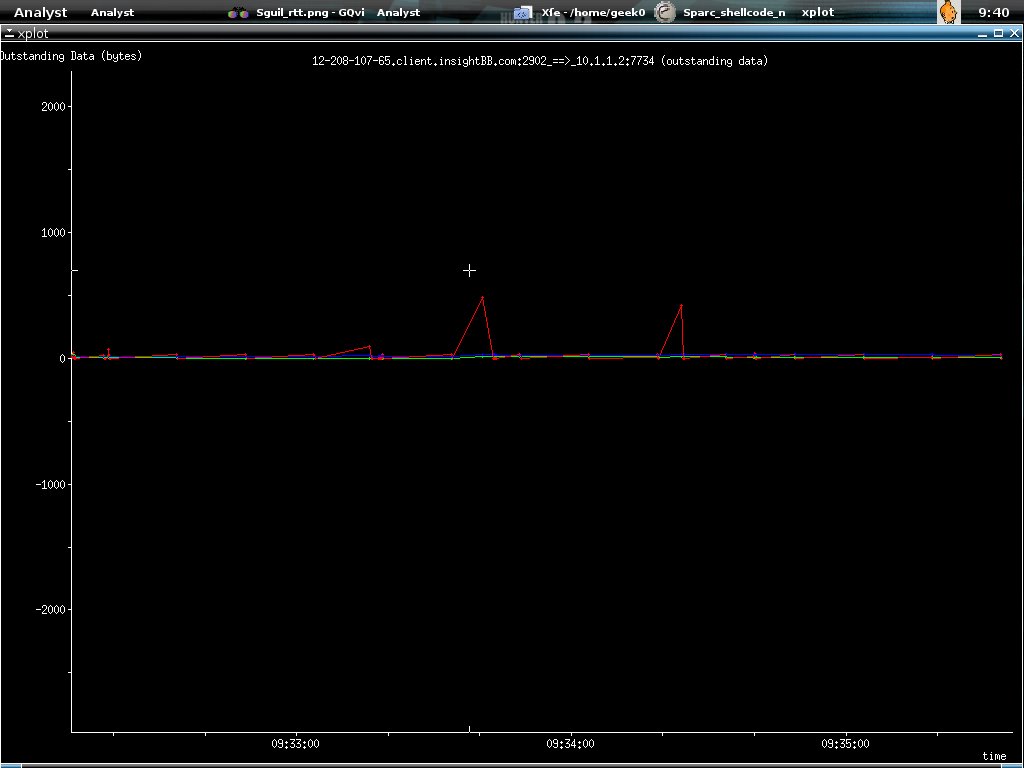
All the graphs here showing traffics from 12.208.10.7.65 to 10.1.1.2. The first graph is illustrating outstanding data bytes. I run xplot to view it. It's not hard to use xplot anyway, if you want to zoom in the graph, just drag your mouse and focus on the part you want to zoom in and left mouse clicking, to exit the graph, just right click your mouse.
Shell>xplot SSC_a2b_owin.xpl
Shell>xplot SSC_a2b_owin.xpl
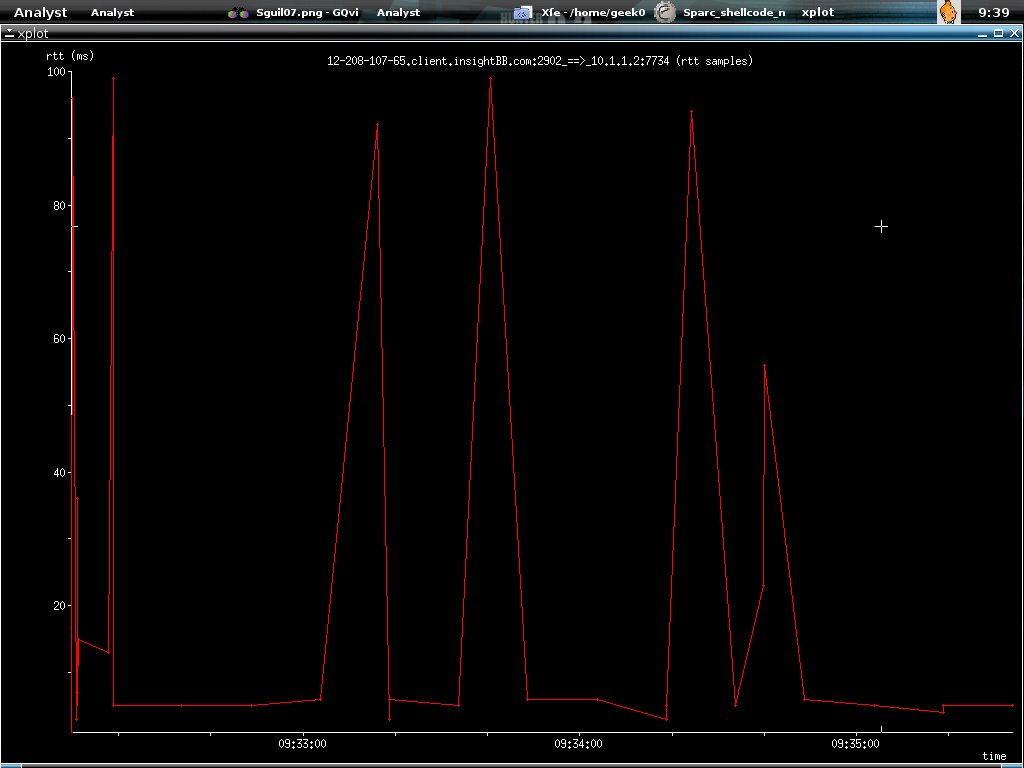
Second graph shows the round trip time :)
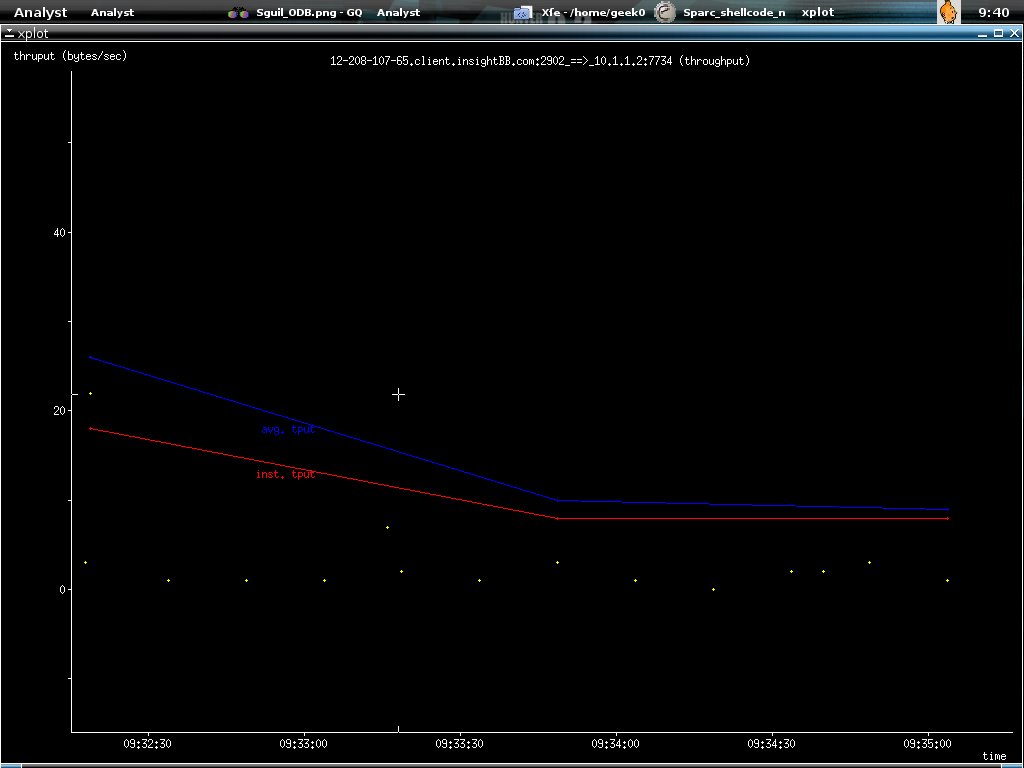
Third one shows the throughput.
This one shows the time sequence graph.

At last we have the one showing timelines, I bet you find this familiar if you read W.Richard Stevens tcp/ip book.
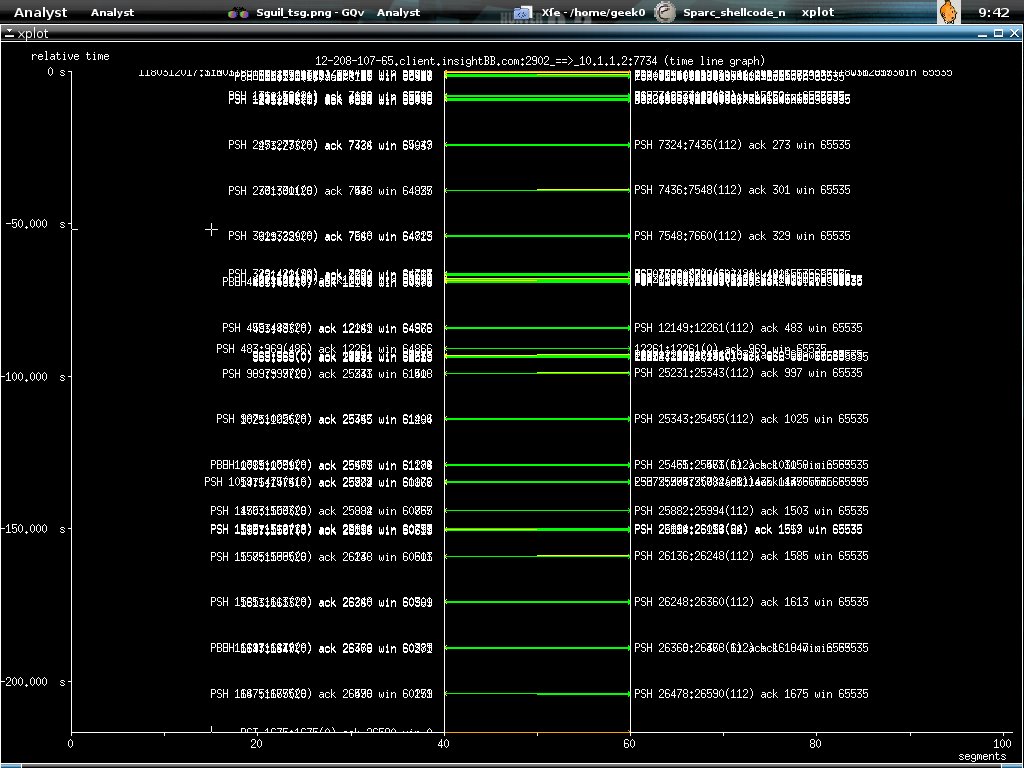
I zoom in by using left mouse clicking.

And the connection been terminated by reset packet sent from 12.208.107.65.

And I exit the graph with right mouse clicking. Now I will show the ttt. I load the MS05-047 exploit traffic, however since I don't filter out other traffics, you will see how ttt does protocol break up. Just enter the command below.
Shell>ttt -dumpfile MS05-047_traffic.pcap
Shell>ttt -dumpfile MS05-047_traffic.pcap

This one showing the progress of the traffic for Sparc_shellcode_noop intrusion when I just run
Shell>ttt -dumpfile Sparc_shellcode_noop.pcap
Shell>ttt -dumpfile Sparc_shellcode_noop.pcap
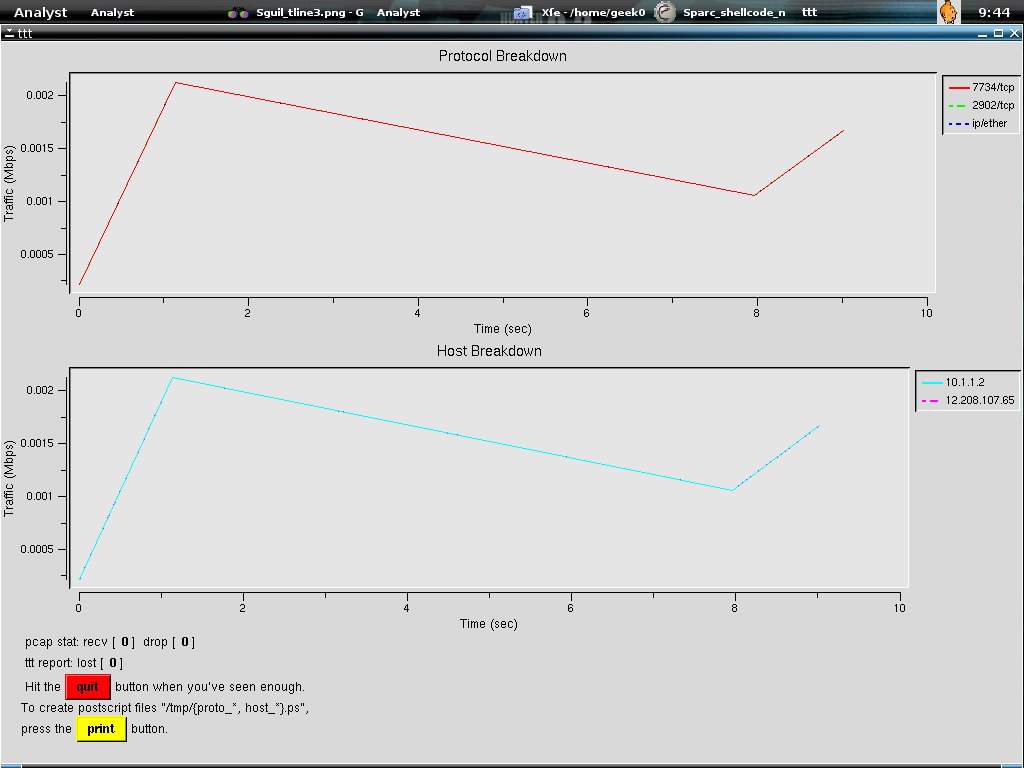 You can print the data in postscript format by clicking on print button below and it will be saved in /tmp.
While I was listening to F-Secure, Mikko Hypponen speaking in HITB2005 Sec Conf regarding viewing malicious code in 3D-graphical view saves a lot of works, will it do the same if we able to view the network data in graphical view, for sure it is, I'm still wondering is there any tools that allow us to load the pcap file to graphical view, and while we click on the graph, it will show which network packet is actually running on that point, that might save a lot of works for both network and security analyst while perfoming Network Troubleshooting and Forensic. I think netdude should be able to do it quickly if they have xplot plugins. However I wish ethereal has this capability to ease the task of network analyst. All the tools above are available in FreeBSD ports/packages, and shouldn't be hard to find it in linux.
My last word here is, please give comments if you read my blog, and tell whether it is good or bad so that I able to improve it, Thanks :-]
I really need inputs from readers .....
My last word here is, please give comments if you read my blog, and tell whether it is good or bad so that I able to improve it, Thanks :-]
I really need inputs from readers .....
2 comments:
thanks!
hey it's really good!
it would have been a bit better if you include which command lines you had used to gererate those xplot graphs.Because I tried to install xplot to ubuntu machine and my graphs didnot look like that unfortunately :( for example the background is not black and RTT data points is not clearly seen.And points are not connected together with a line.
Post a Comment